Quantum Divert Principle (the periodic numbers, recycle bin)

American Butterfly 3

The Network On A String

Quantum Divert Principle (the periodic numbers, recycle bin)

Point eight of SUSY similarity draws to an end. The points directly connected to SUSY and the construction of the global network in terms of “POP” and CFM.

It has not yet been mentioned that alongside the 8 global network cubes eight Independent Satellite Networks are planned as trading hubs, where Mother Networks have more freedom in choosing the locations of their Baby Networks. And Mother Networks may well be born out of larger companies combining, not following the Resort Network system.
Currently, the British Isles, Japan, Dubai and Sparta in Greece are considered with Sparta becoming the Global Network capital.

Below we see a graphical interpretation. The blue cubes represent the eight continental networks, the green and blue loops represent their dependent satellite networks, and the satellite images represent the eight independent satellite networks.

the-global-network

This is what has been theoretically constructed so far. Written within CFM, and “on paper” enabled and made tangible by the various adaptations of the “POP” investment principle.

From physics’ perspective, more often than not the first 7 points of SUSY similarity have looked at the General Relativity, Einstein’s theory of Gravity, or as it is better described “The Fabric of Space and Time.” We have to a degree mimicked Einstein’s Theory to create the fabric of the network, to create the “big picture.”

Point 8 “The Quantum Divert Principle”

From this point forwards, we start to look at the Quantum aspects of the network design. In a way this point and the following create a bridge between the “big picture” relativistic Global Network design and the inner quantum network.
As yet, with the exception of “Chaos Theory” there is no link to this principle to any known physics. It’s just CFM, Compatible Finite Mathematics, which at its heart, is mathematics that eases the chaos caused by rounding errors.
We have used the word “quantum” as we are working within a network, working on the individual daily cash transactions of each business and person. The magic, however, comes from the word “Divert.” Instead of rounding periodic numbers, they are diverted and collated in a type of periodic numbers recycle bin.

Cash handling aside, every transaction within a network is handled by the S-World.Biz financial software, supported by the accounts teams at each operation centre. All are linked to the same financial institutions that use the software and the CFM mathematical principles.

It was initially considered that a small per transaction fee would be levied for using the financial software. However, as other income streams increased, this fee was not prioritised, and is now unnecessary. However it would make the math an awful lot tidier if each time a transaction was less than a cent, the balance was diverted to a “Special Projects” fund (all Special Projects are philanthropic, ecological, earth protecting or complexity protecting).

It’s quite rare for figures to actually tally past a cent. So I see little resistance, especially as it’s looking like network fees are now unnecessary. However if this action meets resistance, the “divert” can be applied at two decimals past the Cent ($0.00001). The point is not to make money. The point is, to streamline the math, first prize being no fractions of a cent seen on any bank reconciliation for any company or staff member. So for instance, a transaction of $246.275 would see $246.27 recorded and $0.005 diverted.

Alongside tidying up the math, this will have the effect of collecting the periodic numbers in one place where they can be combined. For instance, three sets of $0.0033r. (r=recurring) makes an even cent.
An extended example: all shops, suppliers, businesses, banks, land registries, tax levies and salary payments are connected to the S-World.Biz financial software. All are calculated in real time, so that at any given moment, one knows exactly how much money is within an individual network economy.

With modern computing, on the scale of an individual network, this seems a relatively simple task. Until an infinite number arrives, with a recurring decimal which is periodic, a finite sequence of digits repeated indefinitely.
For instance, a company offers three of its staff members an incentive bonus of $1000 if they achieve a set target. Once achieved, each staff member will be due $333.333333333333333333333.r (r=recurring), the sequence of 3’s infinite, indeed far greater than the amount of atoms in our observable universe. Currently banks and financial software will round this figure to say $333.33 with the balance of 3’s lost somewhere in the system. It is this rounding, as per Lorenzian Chaos Theory and The Butterfly Effect that yields the widely diverging outcomes for economic systems, rendering long-term prediction impossible.

So instead of rounding we divert. As such each staff member will receive the same $333.33, with the balance of $0.0033333.r diverted to the Special Projects fund, whereby within this fund, the three complementary sets combine to make an even cent.

Of course, the calculations will not always be so simple, often a $0.0033.r will come in individually and have to wait for a couple of its symmetrical friends to arrive. Further, from time to time a highly complex recurring number may appear such as 3227/555 = 5.8144144144…… where the 144 is repeated ad infinitum.

The system will not immediately solve this problem. However, the simple divert and collate method solves the bulk of the problem. And as we have seen, often CFM is more about calming the jitters than absolute precision, flying in infinities’ slipstream, not being infinity itself.

The other point to this exercise is, even if there is the above degree of uncertainty, the uncertainty is neatly boxed off within the Special Projects fund, which acts as a network recycle bin for periodic numbers. The variance does not directly affect the calculations for the individual businesses within a network, so the network finances are effectively “periodically ring fenced.” And so commerce and salary transactions are always 100% with a Planck length sized variation, in the exact amount available for a Special Project.

Angel POP – Global Benefits

American Butterfly 3

The Network On A String

Angel POP – Global Benefits

Below we see the global picture 32,768 individual networks split into 8 sub sectors, two sub sectors covering the USA. A quick recap on the US timescale: BABY POP sees 256 Mother Resort networks due for launch in 2014, each creating a string of 16 by 2036. This is alongside a second phase of 256 Mother Networks two years later, which in total creates 8,192 networks operational by 2038.

There are 4 main factors when considering the network globally: current GDP output, usable land mass, geography and population. As an ecological solution, the network primarily considers land mass over population.

In 2011 the world used 13,078 Mtoe (Million tonnes of oil equivalent): China 2,648, USA 2,225, India 759, Russia 725, Japan 469, and Germany 317 Mtoe. Current estimates predict baby POP will create around 7,000 Mtoe within the Global Network, with Satellite Networks adding a further 3,000. The second wave of spending set at $1.25 Million for each network creating a further 10,000. In total the network is primed to generate in the region of 20,000 Mtoe from green sources by 2050. This is before any additional voluntary investments, technological advances or Special Project directives (Note, these figures need validating).

Removing fossil fuel usage alone will not rebalance global warming. It will slow it considerably. But to rebalance… the planet needs more oxygen, further photosynthesis, and so more plants. This is tackled in three way: firstly, there is the rule that each resort network needs to produce more oxygen than it did before development; secondly, is the purchasing and protecting of woodland and rain forests across the globe; and thirdly come the special projects, designed alongside other initiatives to turn targeted deserts into rainforests, and in general cultivate arid land.

World Health: via BABY POP within all US networks, 1.6 Billion hospital bed nights are made available each year with a nursing and doctoring level higher than what is generally found in the USA. Take away the luxury service and move to a standard model, and this figure doubles to 3.2 Billion. Take into consideration doctors salaries lowered via “Spartan Contracts” and in general, a policy of training many more doctors. Then take into consideration cost of living adjustments in poorer countries, and the figure doubles again to 6.4 Billion.

The US figures are based on 2 continental cubes. In comparison 4 global cubes are assigned to poorer countries which double the hospital bed nights again to 12.8 Billion. If we say, within these 4 continental cubes 4 Billion citizens live, of which half would be entitled to the equivalent of Medicare or Medicaid, then there will be 6 hospital bed nights per vulnerable person per year, plus pharmaceuticals. Not the same as the USA. But in total, at the age of 41, for me personally, having spent only my birth in the hospital, about 250 days more than I have required so far. Having spent time in Africa and knowing the people of the Mandela Park Township, an experience that in part inspired American Butterfly, this degree of care alongside the pharmaceutical and medicines initiatives would be a giant leap forward.

The Poverty Line gets addressed by the fundamental economics of the network, with lots of well paid jobs and plenty of tax receipts for governments. Education is also provided for, not only at the universities and schools in the networks, but as well as on-line via the S-World UCS training.

PQS_-_One_Planet_-_One_Network_Brighter

At the end of the day, for the have-nots in the world, it all comes down to the success of the network within their area.

7: Angel POP

To the right we see a possible example of how a network would invest its profits, including “Baby POP,” GHB (medical, operational and renewable energy commitments), RES initiatives and Angel POP. Offering eight examples of how Angel POP may be spent.

Angel POP is so named as it dictates. That the networks in less affluent countries will eventually become stable (generating over $1 Billion, then $2 Billion in profit per year). So bringing the benefits associated with a network in terms of prosperity, medical and educational facilities, and an alternate energy source to those that would never have dreamed of such commodities within their lifetime. Angel Pop becomes a philanthropic and ecological initiative which has the very real opportunity of bringing peace and stability to the world. This is via the rationale that (in general) it is the have not’s that look to change their circumstances by extreme measures. Remove abject poverty and replace it with hope, and the probable outcome would be peace, hence Angel POP.

The principle is simply that if a network has a high probability that some time before 2050 it will, by the Angel POP process bringing success, or in the case of a Mother Network’s great success; then the pre-determined nature of the successes affects the desirability of investing in the first place.

Remembering that in the USA big businesses will on average only have options for five cents of investment for every dollar they have in liquid cash. The supply and demand factors from the word go, make networks in other territories interesting, adding all other global businesses. And with the pre-determined long term success, it seems possible to raise funding for networks in third-world countries from the word go.

The mathematics is simple enough. The more networks contributing to the creation of others, the faster others get created, or completed. For simplicity’s sake, we shall work on the principle that the Global Network Cube, not including Satellite Networks, has 32,736 networks where none can receive “POP” investment after they are independently generating over $1Billion.

Moving to the end of the equation, working on networks assigning 50% of their profit to Angel POP, once 90% of the Global Cube is stable, it will be generating 32,763 ÷ 10 = 3,276 x 9 = 29,462 (90% of global cube) ÷ 50% = $14,731 Trillion in Angel POP Investment, destined for the remaining 3,276 networks. Thus on top of its current profitability each will receive $4.5 Billion in additional investment. With this stimulus alongside the other network benefits, it would be in poor form if a network did not to utilize this extra investment to raise its annual profit yield to a figure over $1 Billion in a year.

As a fail-safe consider this, if the last 1% were struggling, the investment by definition adjusts to see 99% of the Global Network Cube, investing the last 1% on unstable networks, seeing $45 Billion a year per network. Thus, once the Global Network Cube has reached 90% saturation level, it will take only a year to complete.
Skipping back to a 70% saturation level, we would see each of the last 30% of networks receive $1.16 Billion a year in investment. This would create a probability that as soon as 70% of the Global Network Cube is stable, the remaining networks will become stable within 5 years.

pqs-commitments-dividends-profit-share-angel-pop

Hence, the pre-determined eventual success that is greatly affecting initial investment desirability.
Two factors need to be considered. Firstly, all POP will not be directed into the Global Continental Cube Networks alone. Some will be destined for Satellite Networks, and Super String Networks. However, the figures as presented have only allowed for networks generating $1Billion each, where many will be doubling that figure, as illustrated in
“M⇔Bst Entanglement > SUSY Hierarchal Spin Equalizer”.
The second factor is Angel RES.

the-angel-pop-principal

8b: Angel RES

Angel RES looks at exactly the same situation. But instead of looking at networks investing via Angel POP they divert their internal (RES based) Economic Stimulus orders to the remaining unstable networks.
So, looking at the last 10% of Global Networks, instead of receiving $4.5Billion a year in investment, they receive $4.5Billion in guaranteed orders.

All told, there are far more reasons for all networks to eventually become stable than there are reasons against.

Angel POP within Physics

(with hindsight)

The initial inclusion of Angel POP within the SUSY 16 was due to its power within the network. Not specifically any universal principle or relevant mathematical similarity to SUSY or other relevant math.

So consideration was given and the question asked: Is there a specific similarity between Angel POP as described and our Universe or Multiverse?

The best answer so far:

Angel POP appears similar to the formation and creation and continuation of a Black Hole, albeit a Black Hole to which the energy that gets sucked in, gets re-distributed back to its universe at the place of the universe’s choosing.

We have the general relativity of the 32,768 Global Network Cube, from which its energy (profit) is slowly, or, if we desire, quickly sucked away, for it to return in quantum mechanical probability fashion to the businesses and citizens within the network. To be calmed and released of its jitters via the various network super string tricks, only to end up once again within an individual network as profit for Angel POP, where it starts its journey once again.

Super String & Quantum String Networks

American Butterfly 3

The Network On A String

Super String & Quantum String Networks

The graphic continues to illustrate Super String and Quantum String Networks which are relevant to all Networks. Looking at point 4 we see a zoom in on Honduras.

Once the Honduras Satellite String Mother Network is established, alongside applying a “POP” investment in its Satellite String partner (Belize), and receiving “POP” investment from Nicaragua, it creates its own Super String Network. Identifying 8 local partners and arbitrarily investing in whichever one it wishes (or the system dictates).
Each of the 8 individual networks within a Super String Network has a $125 Million “POP” threshold, and applies a circular “POP” investment, in the same manner as the Satellite String. At the appropriate time each Super String Network creates a Quantum String Network, a series of 16 micro networks with a POP threshold of just $15.625 Million. At this point we are really looking at the investment into or the creation of small villages.

One thing to note about the creation of satellite, super and quantum string networks always create new cubes, a complete unit that can fit within the CFM cube structure.

As always the Quantum String Network applies “POP” spin. However, this is the end of the road, as soon as a Quantum String Network makes its $15,625 Million. It needs to invest in another Quantum Network in its string until all Networks in the Quantum String generate their maximum, so equalling $250 Million. This, added to the seven other Quantum String Networks, generates $2 Billion, which added to the Super String Networks and the Mother Networks, brings us back to an even $4 Billion.

However once a Quantum String has generated its $250 Million, it is allowed to double its threshold to $500 Million. Albeit, to keep uniformity over time, each Quantum String Network will invest in slower moving Super String Networks dependent to its Mother Network.

(Please note the symmetry within an original M⇔Bst string network breaking itself down into POP, only to eventually replicate itself in Mandelbrot fractal fashion in a new territory.)

Super String and Quantum String Networks were designed for the purpose as outlined above, specifically to ease the jitters between the USA and its neighbours, so one could start American Butterfly without hindrance from bureaucracy. This said the principal of Super String and Quantum String Networks can work within the USA networks themselves, with Mother and Baby Networks alike creating Super String and Quantum String Networks when it is deemed effective.

Where this principle would really assist within the USA is in terms of City Integration, purchasing or building a shopping mall here or a property development there and so on.

pqs-super-string-quantum-string-networks

Satellite String Networks

American Butterfly 3

The Network On A String

Satellite String Networks

Satellite String Networks as well as the following Super String and Quantum String Networks are probably the first actual network design ideas created as a direct influence from String Theory. Indeed, it was the creation of these types of networks that gave way to the realisation that one could rightly class the networks created by the “Baby POP (M⇔Bst) investment principle as strings themselves, albeit, open strings as opposed to closed strings. The advantage of closed strings being the extra level of spin added, as the POP investment principle circles around the string continuously. In general and within networks, the more types of spins, the stronger the network.

Satellite String Networks look at the expansion of the original M⇔Bst Baby POP networks. This is a concept far easier to explain with the graphic as seen on the right.

At position 1 we see the USA is made up of two continental network cubes, each containing 4096 networks. On the right we see these cubes are broken down 8 times into master cubes containing 512 Networks per cube. At position 2 we see eight Florida based network strings, collectively making a collection of 128 networks. Albeit at the time of initiating each string may still be a solitary Mother Network

(Note: due to M⇔Bst Hierarchal SUSY Entanglement, this figure could reduce to 64).

The idea of Satellite Strings came from solving a logistical problem. The Global Network created from Baby POP M⇔Bst strings is destined to contain 32,768 individual networks. Split into eight continental cubes: two in the USA, one in South America, and five covering the rest of the world. To create balance; Canada, Central America and the Caribbean Islands needed to be attached to the USA cubes. However, the politics of making any such agreements would slow down the procedure. Hence Satellite Strings.

The USA would have exclusivity over the 2 continental cubes, where after, it would create Satellite Strings to Canada, Central America and the Caribbean Islands. The process sees all networks in an M⇔Bst string invest “per POP method” into creating a specific Mother Network abroad. This is alongside 7 other network strings doing the same, so creating a collection of 8 continental satellite Mother Networks, where by each new network “POP” invests into the next.

However, unlike M⇔Bst strings, the investment would circle not end at the final M⇔Bst string. This being so, an additional level of Spin (capital injection) is added. Alongside “POP” investment from its continental USA network or networks. The closed string would be continually invested into itself. (Note, often one will find different Mother Networks across the USA feeding the same continental satellite network, particularly if it has a valuable resource).

It may be simplest to consider M⇔Bst string networks as Open String Networks, and Satellite Networks as Closed Loop Networks as the POP investment flows in a continuous circle. As such if a network should stall (lose money) it is re-energized not only by its USA String or Strings; it is also re-invigorated by its own string.

pqs-continental-satellite-string-networks

M⇔Bst > SUSY Hierarchal Spin Equalizer

American Butterfly 3

The Network On A String

M⇔Bst > SUSY Hierarchal Spin Equalizer

This was the tipping point that paved the way to this chapter “16 Points of SUSY Similarity.” This was in essence the 16th point. It’s quite amazing how the simplest of principles from Supersymmetry can make such a difference.
After the 4th network within a string Baby POP requires networks to make $500 Million in profit. In general, each Baby Network will be designed to have at least 10% of its companies, on M⇔Bst “Suppliers Butterfly” contracts. Which in after four years it should produce $196 Million in profits. Added to this are the profits from the other 90% of businesses, which should generate at least 40% of investment money, which would be $1.8 Billion x 40% = $720 Million.

So as a base forecast for an “inner string” Baby Network, we add the $150 Million from operational profits, the $196 Million from M⇔Bst “Suppliers Butterfly” businesses, alongside the $720 Million from standard businesses which equals $1.066 Billion. On top of this, we would expect various profits from technology companies, albeit, the benefits will vary from network to network.

The profit made by an “inner string” Baby Network can of course be spun. The RES equation and the technology profits increasing “expected” earnings into the $1.5 Billion area.

On the right we see a graphic for the rather grandly named:

“Baby POP > Entanglement > SUSY Hierarchal Spin Equaliser 1.”

Along the top, we see a possible 2040 forecast for the profitability of a completed Baby POP string of networks. For the Mother Network, considering the “Suppliers Butterfly” shows that in 2036 the annual profit margin for a M⇔Bst “Suppliers Butterfly” business in relation to the original investment rises from 98% to $429%. The collective $196 Million from supplier companies expected in 2018 rises to $858 Million. Technology profits are also expected to rise, as are all profits over the 22 years.

In light of this, by 2040 an average Mother Network is displayed as generating $4.6 Billion. After which we see a steady decline in profits over the next five or six networks, as technology profits are lower and the more lucrative tenders are possibly snapped up first (Albeit, there is a countermeasure being considered to negate this).
From the 7th network onwards a hit or miss pattern is displayed, indicating the element of chance that would be involved in the process. Please note in red, the three sub $1 Billion networks. Officially this should not be possible. But we need to account for the law of “shit happens” so three sub $1 Billion networks are included for safety and to keep with the “lowest probability” tradition.

We see the lowest earning network is generating $600 Million, which as far as Baby POP is concerned is fine. But for the businesses themselves, looking at half their profit going to operations and RES initiatives, it would be seen by some as a hindrance (Note, the last network “The Boat” is so strong due to continuous Baby POP investments).

baby_pop_entanglement_susy_hierarchal_soin_equalizer1

At this point, to help balance the books, we borrow a technique from Supersymmetry.
But before we do a quick word on the map, on the bottom right we see the “Florida Networks,” separated into 10 approximate 6000 square mile territories. These are to be created by the two phases of 512 US Mother Networks between 2014 and 2017 (presuming a 2014 start).

Once a Mother Network is created within a catchment area it creates 16 subdivisions, as show on the bottom left map “Orlando String”. Within this map you see the 16 territories of the 16 networks, within a completed Baby POP String, serving an approximate land area of 380 square Miles (Half the size of Surrey, twice the size of Barbados).
As you can see on the Orlando String Map, in terms of profits equilibrium, we are almost in complete chaos.

Over time, various ideas on how to equalise the vastly different degrees of successes and profit that may befall an individual network within a string have been considered. All rewarding various degrees of minimal success, until I saw a three minute U Tube clip on SUSY, courtesy of Jerome Friedman.

Jerome Friedman revealed:

Supersymmetry suggests that for every particle there is a partner which has the opposite spin symmetry. This solves the so called hierarchy problem which assists in closing the gap in energy scales. The grand unification scale is about 16 orders of magnitude beyond the electroweak scale, where after, within the Planck scale, gravity and quantum theory have to come together. Hierarchy assists SUSY to bridge what most physicists feel is an un-intuitive and unnecessary amount of fine tuning within nature.

Supersymmetry is a broken symmetry, as the super symmetric particles do not have the same masses as their partners.

In other words, and taking reference from a little more research, within supersymmetry, balance is maintained by the largest particles twinning with the smallest particles. It is a principal that goes hand in hand with calming the jitters between Quantum Mechanics and General Relativity.

This was a “Lightening Bolt” of inspiration.

We need to entangle the strongest and weakest networks within a string.
And, as an afterthought…do it in such a way that it does not duly inconvenience the business owners in the stronger string.

To our right, the graphic says an awful lot in very few words:

By annually partnering the strongest and the weakest networks within a string and by entangling them together we solve and will continue to solve the hierarchy problem within the string. Smoothing outputs and adding to the predictability, far more than any previously considered initiatives.

If we take the extreme example where the Mother Network generating $4.6 Billion is entangled with, and Network 13 which only generates $600 Million, we consider ways in which the stronger can help the weaker.

One idea would be, for the stronger network to pick up the slack in terms of the operational, medial and alternate energy expenses. At the same time the Mother Network could divert some of its internal RES, at a QE score closer to 65% a token $400 Million would generate an additional $260 Million in profit for Network 13. Another possibility is the Mother Network picking up the POP payments, allowing Network 13 to concentrate all its profits into RES and Internal Stimulus, to assist in its growth.

Any combination of these three measures are more than enough to generate extra growth in the weakest network, until it is happy to stand on its own two feet. They are after all, just babies.

baby_pop_entanglement_susy_hierarchal_soin_equalizer2

The original POP directive was to organise individual networks’ into boxes of profit close to $4 Billion. By copying one small detail from Supersymmetry, that goal gets a lot closer.

The very same system could later be used on a larger scale. As the Orlando string will eventually form a cube of 8 with its neighbours. Within this cube, the same system could be adopted. After this, the 8 cube will at some time attach itself to its neighbours to create a 64 cube, and so on and so on. Using this type of reasoning, smoothing the profits out within all 8,192 cubes within the US Network and from there the Global network should be simple enough.

This action solves another problem as it brings the complete Network String back into a unit of 8, so a perfect cube.

CFM and the “POP” (M⇔Bst) Investment Principle

American Butterfly 3

The Network On A String

Prequel


CFM and the “POP” (M⇔Bst) Investment Principle

By Nick Ray Ball Decemeber 2012

Part 1. CFM – Compatible Finite Mathematics
Part 2. POP – The Pressure of Profit
Part 3. The Baby POP (M⇔Bst) Investment Principle

CFM – Compatible Finite Mathematics

CFM is the mathematics of the network. The principals ingrained in me throughout the 12 years I spent as a Music Programmer before I moved into web development in 1999. For music, the software I used was called Q-Bass. And for 12 years most days I worked with 64 tracks, making sets of 8 bars. Looking at the micro structures within and joining them together to make songs.

The reason the network was built around CFM was probably due to instinct, but definitely the need to accommodate a global knockout league structure. The initial considered “The FIFA Global League,” an idea they coveted, and a company I knew well enough to get an audience with, should I wish. And so it was that the S-World Network and business plan revolved around 16 global consortiums/franchises, which were to be sub divided, and subdivided again in sets of 4, 8, 16 and 32.

Six months later, after an interest in Chaos Theory had seen me attempting to solve the problem of “rounding errors” within the network mathematics I wrote an instinctive equation: E x TOE = MC2 + TOE/∞ -16 = 16 PPG. And which in turn resulted in an exploration of the Mandelbrot Set Fractal, from where the concepts of finite math, doubling numbers, and creating baby networks originated.

Originally entitled “Chaos Science,” CFM looks to simply box things nicely into cubes. One symmetrical cube fits inside another 8 times, eight fit inside another eight times, so giving 64 and so we count 1 > 8 > 64 > 512 > 4096 > 32768. One represents a single network, whereas 32,768 would be the 2050 Global Network Cube.
The basic principle is to organise accounting within number sets that are manageable, which when multiplied or added cannot lead to periodic numbers. One can seemingly use 2 > 4 > 8 > 16 etc, but this is best used in such a way as to make a block that can neatly fit inside a cube.

S-World Network - POP - Cubes/Dimensions (2012)

CFM: Compatible Finite Math is the art of compartmentalising businesses and networks earnings. So they fit neatly into cubes, hence SUSY, like the link between General Relativity and Quantum Mechanics, where one can’t marry the probability of Quantum Mechanics with the certainty of General Relativity. Equally, within a network one can’t possibly add up all the separate companies’ earnings and hope they will magically tally into an even $2 or $4 billion unit.

Instead, we are looking to smooth the jitters and create a work-around; hence the name “COMPATIBLE Finite Math” not “Finite Math.” One can consider the cube structure as “Finite Math,” the quickest and most symmetrical way to compartmentalise; everything fits inside of everything perfectly, even for a human it makes calculations simple, especially within a 3D simulated hologram, as it should be presented.

As an initial consideration it really is that simple. If in the very distant future all economics were centred on units that were in simple blocks which when added could never create an odd number, it would be pretty hard to run out of processing power when calculating them.

In respect of the mission to make the physics and principles simple, at the time of initial consideration a cartoon was created to illustrate the principle.

pqs-barney-toda

POP – The Pressure of Profit

The “POP” principle was created specifically to build the network structure in CFM, where network earnings would fit neatly within the 1 > 2 > 4 > 8 > 16 framework. Albeit it was considered as the number “1” was odd, the sequence needed to start at 2 > 4 > 8 > 16 > 32 > 64 etc.
Initially considered and applied to profit forecasts from the August 2011 concept “Facebook Travel,” starting in “New Sparta, City of Science” Greece, and then expanding across the globe. Creating and developing new resort networks and operation centres along its journey.

pqs-resort-network-development

riginally the “POP” principle started with network sectors generating $4 billion in profit. And considered, if all the profit made over $4 billion was saved, until it could be used to build a new network, and thereafter another and another. The network would build itself in units that all made $4 billion. So long as a network performed, it would always generate $4 billion. Its profit would become predictable and when considered on a gargantuan scale, the figures would stick to the framework of CFM.

There are a couple of points of argument that required solutions. But in the same way that removing humans from financial data-capturing positions would be an improvement in financial efficiency it is not a cure to all financial problems. The “POP” principle was a further improvement. In many ways CFM is about using as many tricks as one can, to guide network profit into creating more and more stable networks/cubes, herding them together within the 1 > 8 > 64 > 512 > 4096 > 32768, pure “Finite Math” cubed hierarchal structure.

At this point, an argument is presented for teaching Photoshop to math and physics majors. As if not for the ability to create graphics, the huge “added advantage” to the “POP” principle may never have been considered, as whist plotting out “POP” global expansion up popped an interesting side effect.

the-pop-investment-principal

Of course, the more networks contributing to the creation of the next network, the faster new networks would be created, hence the name, the “Pressure of Profit” (POP).

In October 2011, the creation of the “POP” investment principal saw the creation of the first semi competent physics chapter within “The Spartan Theory.” This chapter put the physics centre stage with economics and was named “EEE – The Economy for the next 14 Billion Years.” The EEE stood for “Ecological Experience Economy,” and the reference to 14 Billion years was reflective of the consideration that if at this point we were to start an economic system based around the POP principle. Like the cartoon showed in 14 Billion years time, it would make the universal economy manageable.

“POP” is one way we assist the network to stay within its CFM framework. Not perfectly, but by the time the various other techniques are added, we have a manageable finite economy, with the jitters suitably calmed.

The Baby POP Investment Principle (M⇔Bst)

The precocious “Baby POP”

Eight months after creating “POP,” a refined version lowering its profit cap was created; the precocious “Baby POP” (M⇔Bst) investment principle. “Precocious” because it is not creating nice even boxes, just starting the process. As a standalone piece of mathematics, one would never tell that it is a part of a larger plan to eliminate rounding errors.

Before describing and presenting the “Baby POP” spreadsheet, maybe it’s best to explain why “Baby POP” was necessary in the first place. The original “POP” investment principle was created around the New Sparta property development, a collection of adjoining physical networks in Greece. Due to the various profit centres provided by affiliate and other initiatives, the mathematics were such that it was possible for each individual New Sparta network to generate over the $4 billion profit per annum within three or four years. Increasing upwards thereafter.

The “Give Half Back” principle was applied with 50% being split between dividends and initiatives to support the networks and Greece, generating more than enough money to support extensive research and development whist stabilising the Greek economy. With the other 50% was saved and then used to create new networks in other global locations as per classic “POP” method.

When the starting point was moved from Greece to the USA, as Greece’s budget deficit at the time was $41 billion in comparison to the USA at around $1,500 billion, either a lot more networks were required or networks needed to create more profit. As such, for a starting position in the USA the number of networks was multiplied by 16, so creating an eventual target of 8,192 networks.

Initially the calculations were worked out by looking to create these 8,192 networks in one phase, which was logistically and financially possible but far from ideal. Moreover the trouble was that the revenue and profits calculated from the affiliate systems had to be divided by 16, and as such each individual network was not making anywhere near enough profit.

For a while, an element of doubt cast its shadow over American Butterfly. And considerations of the “POP” principle were cast aside as work commenced into the logistics of retail catchment areas and other revenue streams that could create direct profit for the individual networks. A useful exercise but ultimately the figures were not supportive of a successful venture.

Eventually, considerations returned to the POP principle but looked at a much longer timescale. Starting with fewer networks and working to build towards the eventual critical mass of 8,192 networks. The initial phase of networks halved, halved again, and again. Until eventually a figure of 256 initial networks were generated. Approximately five per US state was decided upon for a first direct investment phase, with the same amount again planned a couple of years later, where after each would over a 22 year period via “POP” method create 15 subsidiary networks.

Logistically this worked, as initially the affiliate revenue streams and profits split between the 512 networks were enough to satisfy the investors, support the operation centres and still save up enough money to invest in their subsidiary networks. As the pace of network creation was far slower, it also allowed time for the networks to generate independent income from their local catchment areas over time.

The pure “POP” concept of initially generating annual profits of $4 billion was adapted to lower figures. For the first phase the figure was lowered to $800 million, where after $700 million for the first subsidiary network. After that is $600 million for the second one then $500 million for the balance of networks.

The graphic below and the following spreadsheet follow the “Baby POP” journey. Creating the critical mass of revenue required to power the USA and absorb the Medicare & Medicaid costs by the mid century.


pqs-baby-pqs-us-network-string

Baby-POP-_28Used

Above we see the first of four double pages illustrating the creation of an M⇔Bst “Baby POP” string.
Starting with the basics, top left RN stands for Resort Network. This is followed by the year.
In the row beneath after 2014 we see an initial investment. Usually this comes in one chunk at the beginning of the process. However for the first network, half ($1 billion) comes in 2014 the balance in 2016 and 2017. This allows plenty of time to choose appropriate local companies as partners.

Next we go to the annual profit; $200 million in 2014 rising to $800 million in 2017. Totalling $2 billion over the first 4 years, most of this profit can be generated by the internal construction process.

Moving over to the right hand side of the spreadsheet in 2014 we see $200 million recorded as cash flow and subsequently banked.

In 2015 the process repeats. This time adding an additional $400 million in profit to the $200 million and placing $600 million in the bank.

In 2016 $600 million is recorded as profit. This added to the $600 million in the bank affords a $1 billion cash injection into the Resort Network construction process (Re-invest column).
2017 is the last year before the Mother Resort Network enters the “Baby POP” process. Until now all operational expenses are covered by the initial investment and no capital has been used for Special Projects.

In 2017 RN1 generates $800 million in profit which when added to the $200 million left in the bank allows a $1 billion investment into the next resort, RN2, the baby of RN1. This $1 billion is matched by new investment and becomes the start up funds for RN2.

Before examining RN2 please look at the bottom (dark purple) line of RN1. To the left $800 million in annual profit is recorded, to the right we see the profit split into 3 divisions, GHB (Give Half Back) is operational expenses, solar and other alternate energy projects & medical initiatives. Then the balance of $500 million is split 75/25 with $375 million becoming the “Baby POP” investment into RN2 and $125 million returned to the company owners and share holders as network credit dividends.

RN2: Starting in 2018 RN2 starts immediately with $2 billion in investment, half from RN1 and half from new sources. Each year a profit of $375 million in “BABY POP” added to their general profit. Investment from RN1 is injected into the resort so allowing the $1 billion internal re-investment in two years not three and the $1 billion investment to create RN3 in three years not four.

RN3: 2021 please note “POP A” investment from RN1 now by-passes RN2 and goes straight into RN3. Please also note prior to this in the column “POP Over” $525 million has been recorded from the “POP 75%” column of RN2 in 2021. This “POP Over” system happens in all RN’s until their fifth year when the “BABY POP” process starts outright. At which point in 2022 we see RN3 fuelled by “POP A” and “POP B.”

Baby-POP-_28Used-1

Taking an overview, above we can now clearly see the “Baby POP” process at work. Please note the cost of “Baby POP” decreased over the first four years (in RN1 $375 million, in RN2 $300 million, in RN3 $225 million, and from RN4 onwards $150 million). Please also note profit input has been lowered from $800 million to $500 million. This is partly in consideration of lucrative tenders being snapped up by the first four networks, and partly to allow for the WOW factor diminishing over time, lessening the PR benefits.

However this lowering of expectations is not simply a precautionary measure. As important is the principle that from the fourth Resort Network onwards $150 million is all the capital that is needed to complete the league of 16 resorts in a timely fashion. And so leaving additional earnings for “Angel POP,” Satellite and Super String Networks.

In 2023, by the time of the launch of RN4, it is receiving over $1 Billion a year in “Baby POP” funds from RN’s 1, 2 & 3. By 2025 “Baby POP” funds from RN’s 1, 2, 3 & 4 are enough to create a new Baby Network every year.
Note: As the “Baby POP” process diverts from Baby to Baby, the Mother (Anchor), first and second Babies develop strong footholds in every network within the string, in many cases opening new stores or business interests throughout.

Note: Profits from the Operation Centre including: Sale of energy, private clients at hospitals, advertising revenue, network charges and all building profits (not suppliers) are distributed to the businesses within the network increasing earnings by +/- $150 million.

Baby-POP

Moving into the second half of the creation of an M⇔Bst “Baby POP” Network String, come 2029 the network is flying. Recording just under $2 billion a year from “POP Over” and “POP A to E,” by this point the “Baby POP” process has for all intents and purposes created a mini tidal wave of profit which is all but unstoppable. Should any network have a hiccup, it will make little difference.

Come 2034 and the launch of Resort Network 14, the tidal wave of “Baby POP” capital injections have collectively reached over $2.7 billion a year, from 11 different sources.

Baby-POP

In 2036 the 16th & final Resort Network is launched receiving over $3 billion in its first year. However as RN16 has no baby and instead of investing in a new Baby Network it strengthens by investing in itself, procuring raw materials, minerals, metals and other tangible assets alongside building industry and energy resources.

By its fifth year, the year it starts contributing to operations and projects, before making a cent in profit Resort Networks 16 will have internally invested over $11 billion dollars. This investment will undoubtedly result in the final Baby Network internally generating over $1 billion a year, and so it becomes stable. Indeed a stable network that still receives $2.7 billion a year from the “Baby POP” process.

And so with the initial network RNI receiving the most e-commerce profits and RC16 receiving “Baby POP” funds on top of its general profits the first and last networks in the league have significant strength and make considerable profit. As such RN1 adopts the name “The Anchor” and RN16 “The Boat” as it is ready to sail on to new ventures.

Quantum Force Theory, Spin & the RES ⇔ Equation

American Butterfly 3

The Network On A String

Quantum Force Theory, Spin & the RES ⇔ Equation

Quantum Force Theory

Had it not been for the tangible results and profit centres created by the RES equation, its unlikely Quantum Force Theory would have received a mention, as it’s not necessarily correct. However, as it opened the door to the creation of both The Suppliers Butterfly and the RES equation, for posterity the source is presented.

Just as the discovery of the accelerated growth pattern created by the “POP” principle was only realised whilst creating a graphic, Quantum Force Theory and its tangible cohort the RES equation started in a similar way.

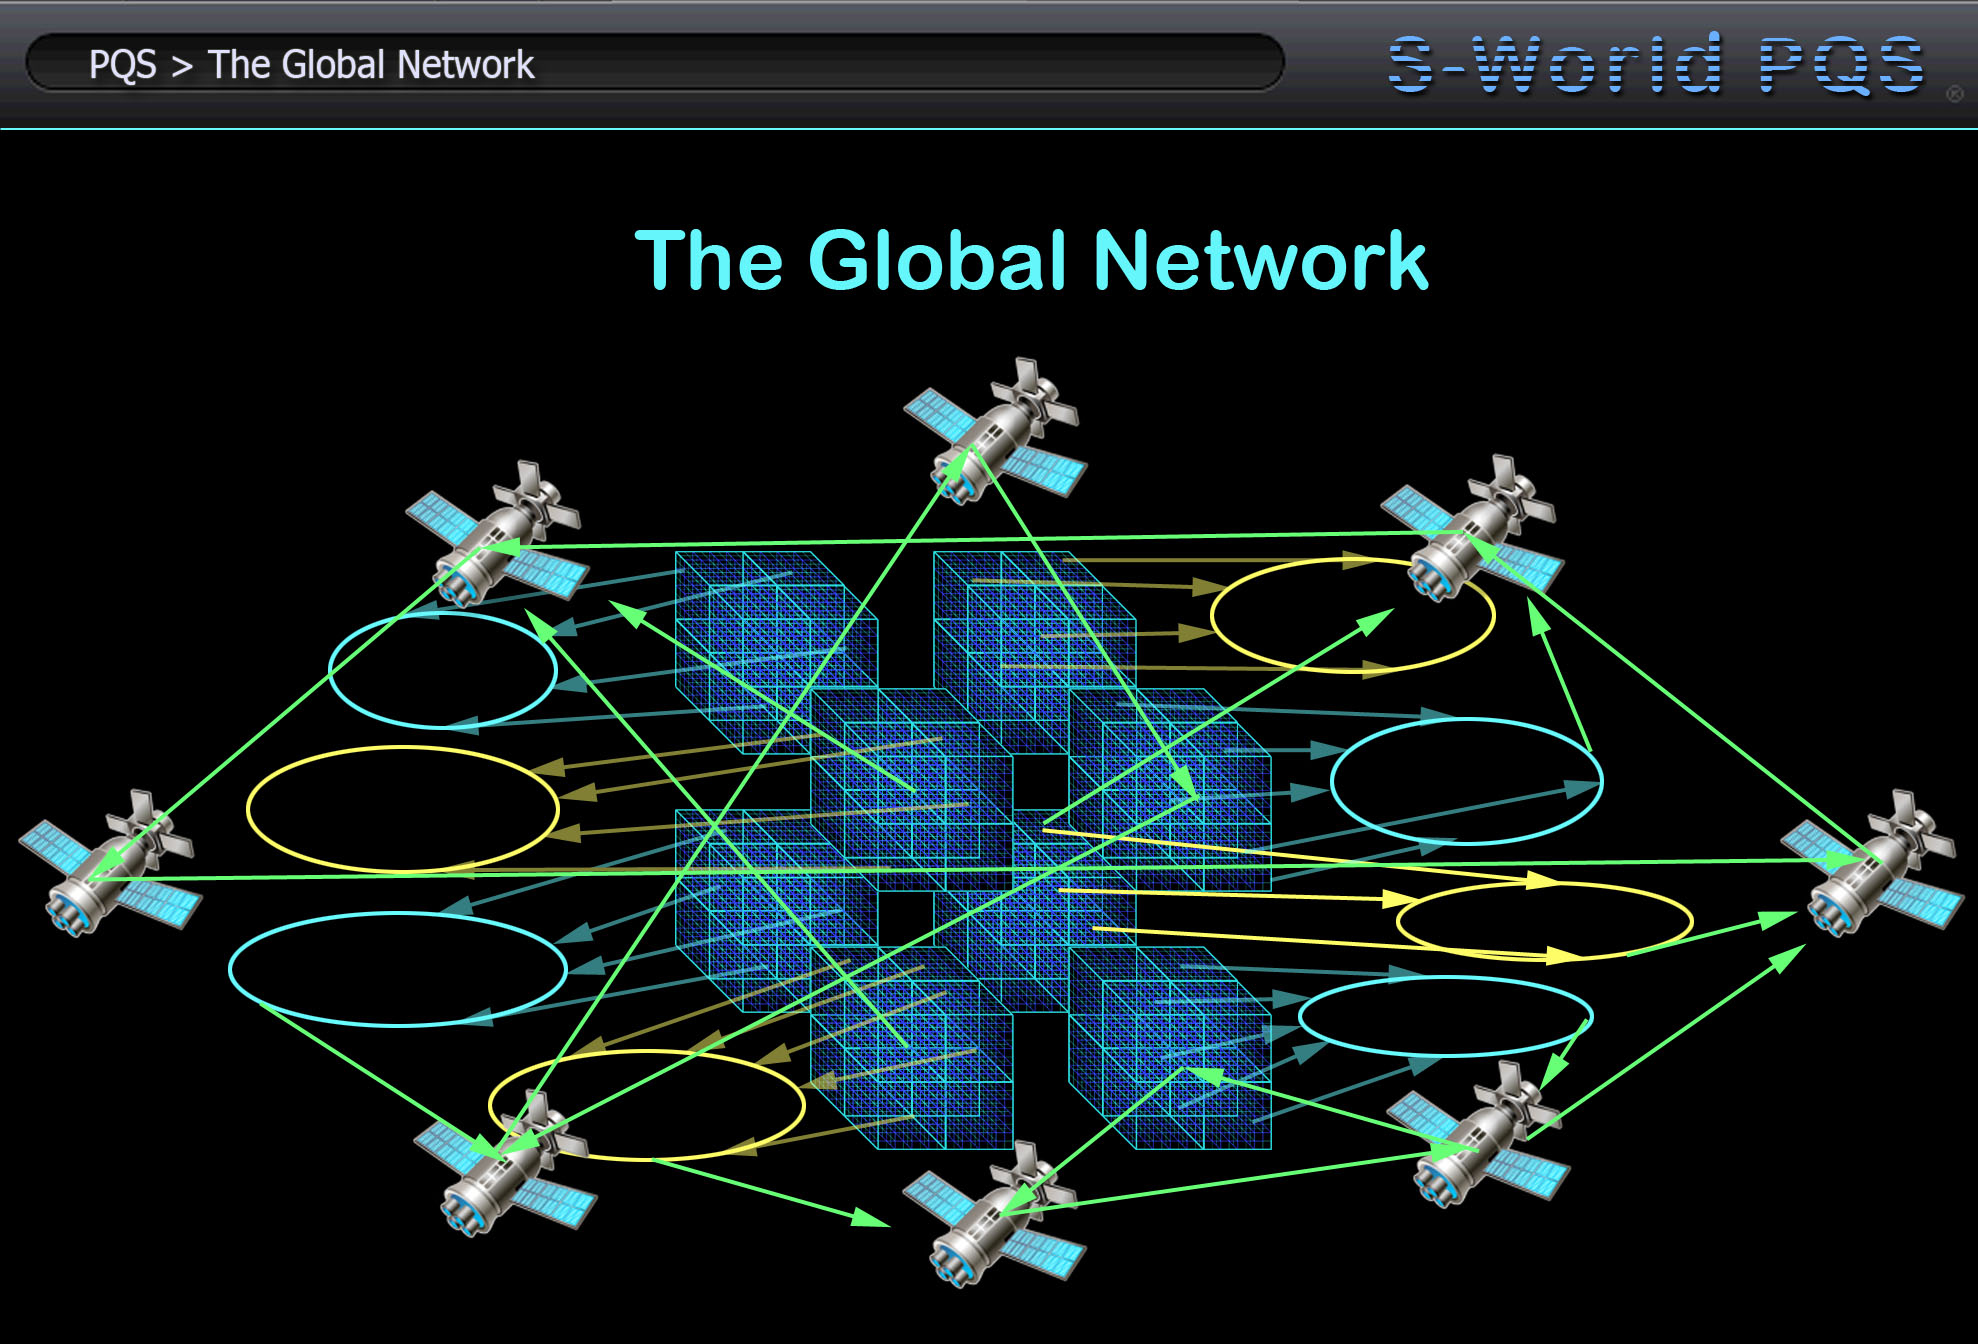
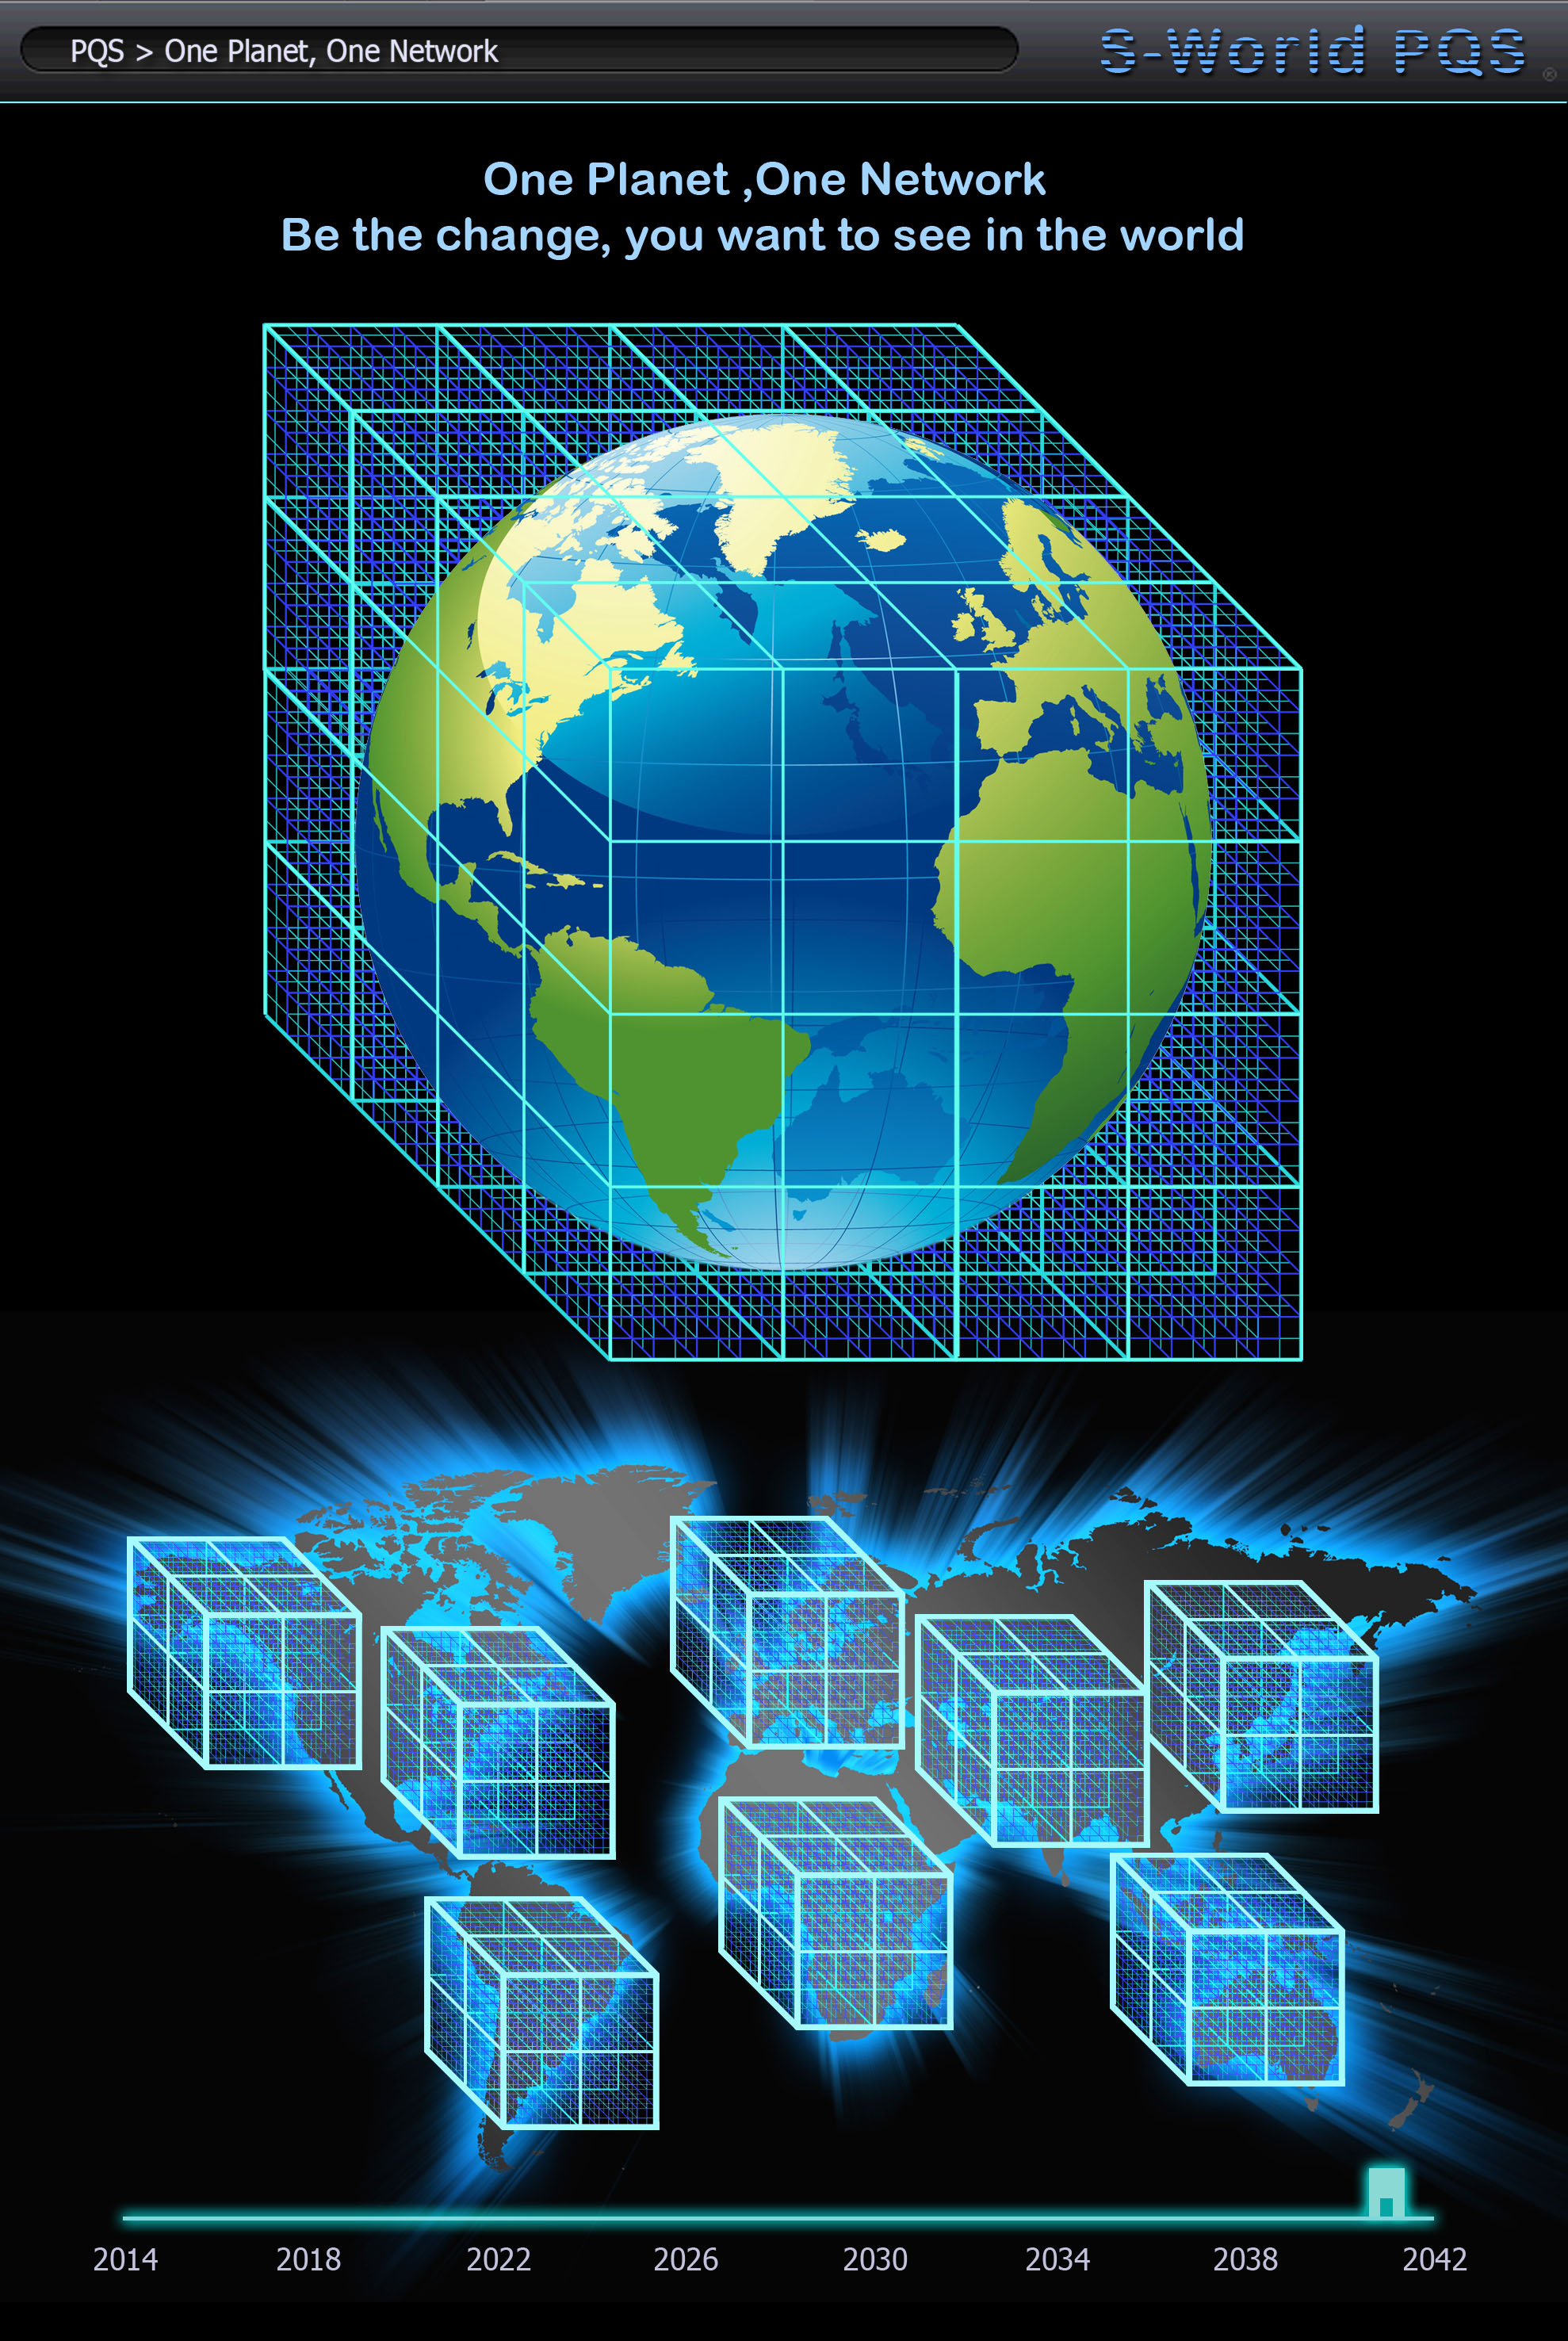
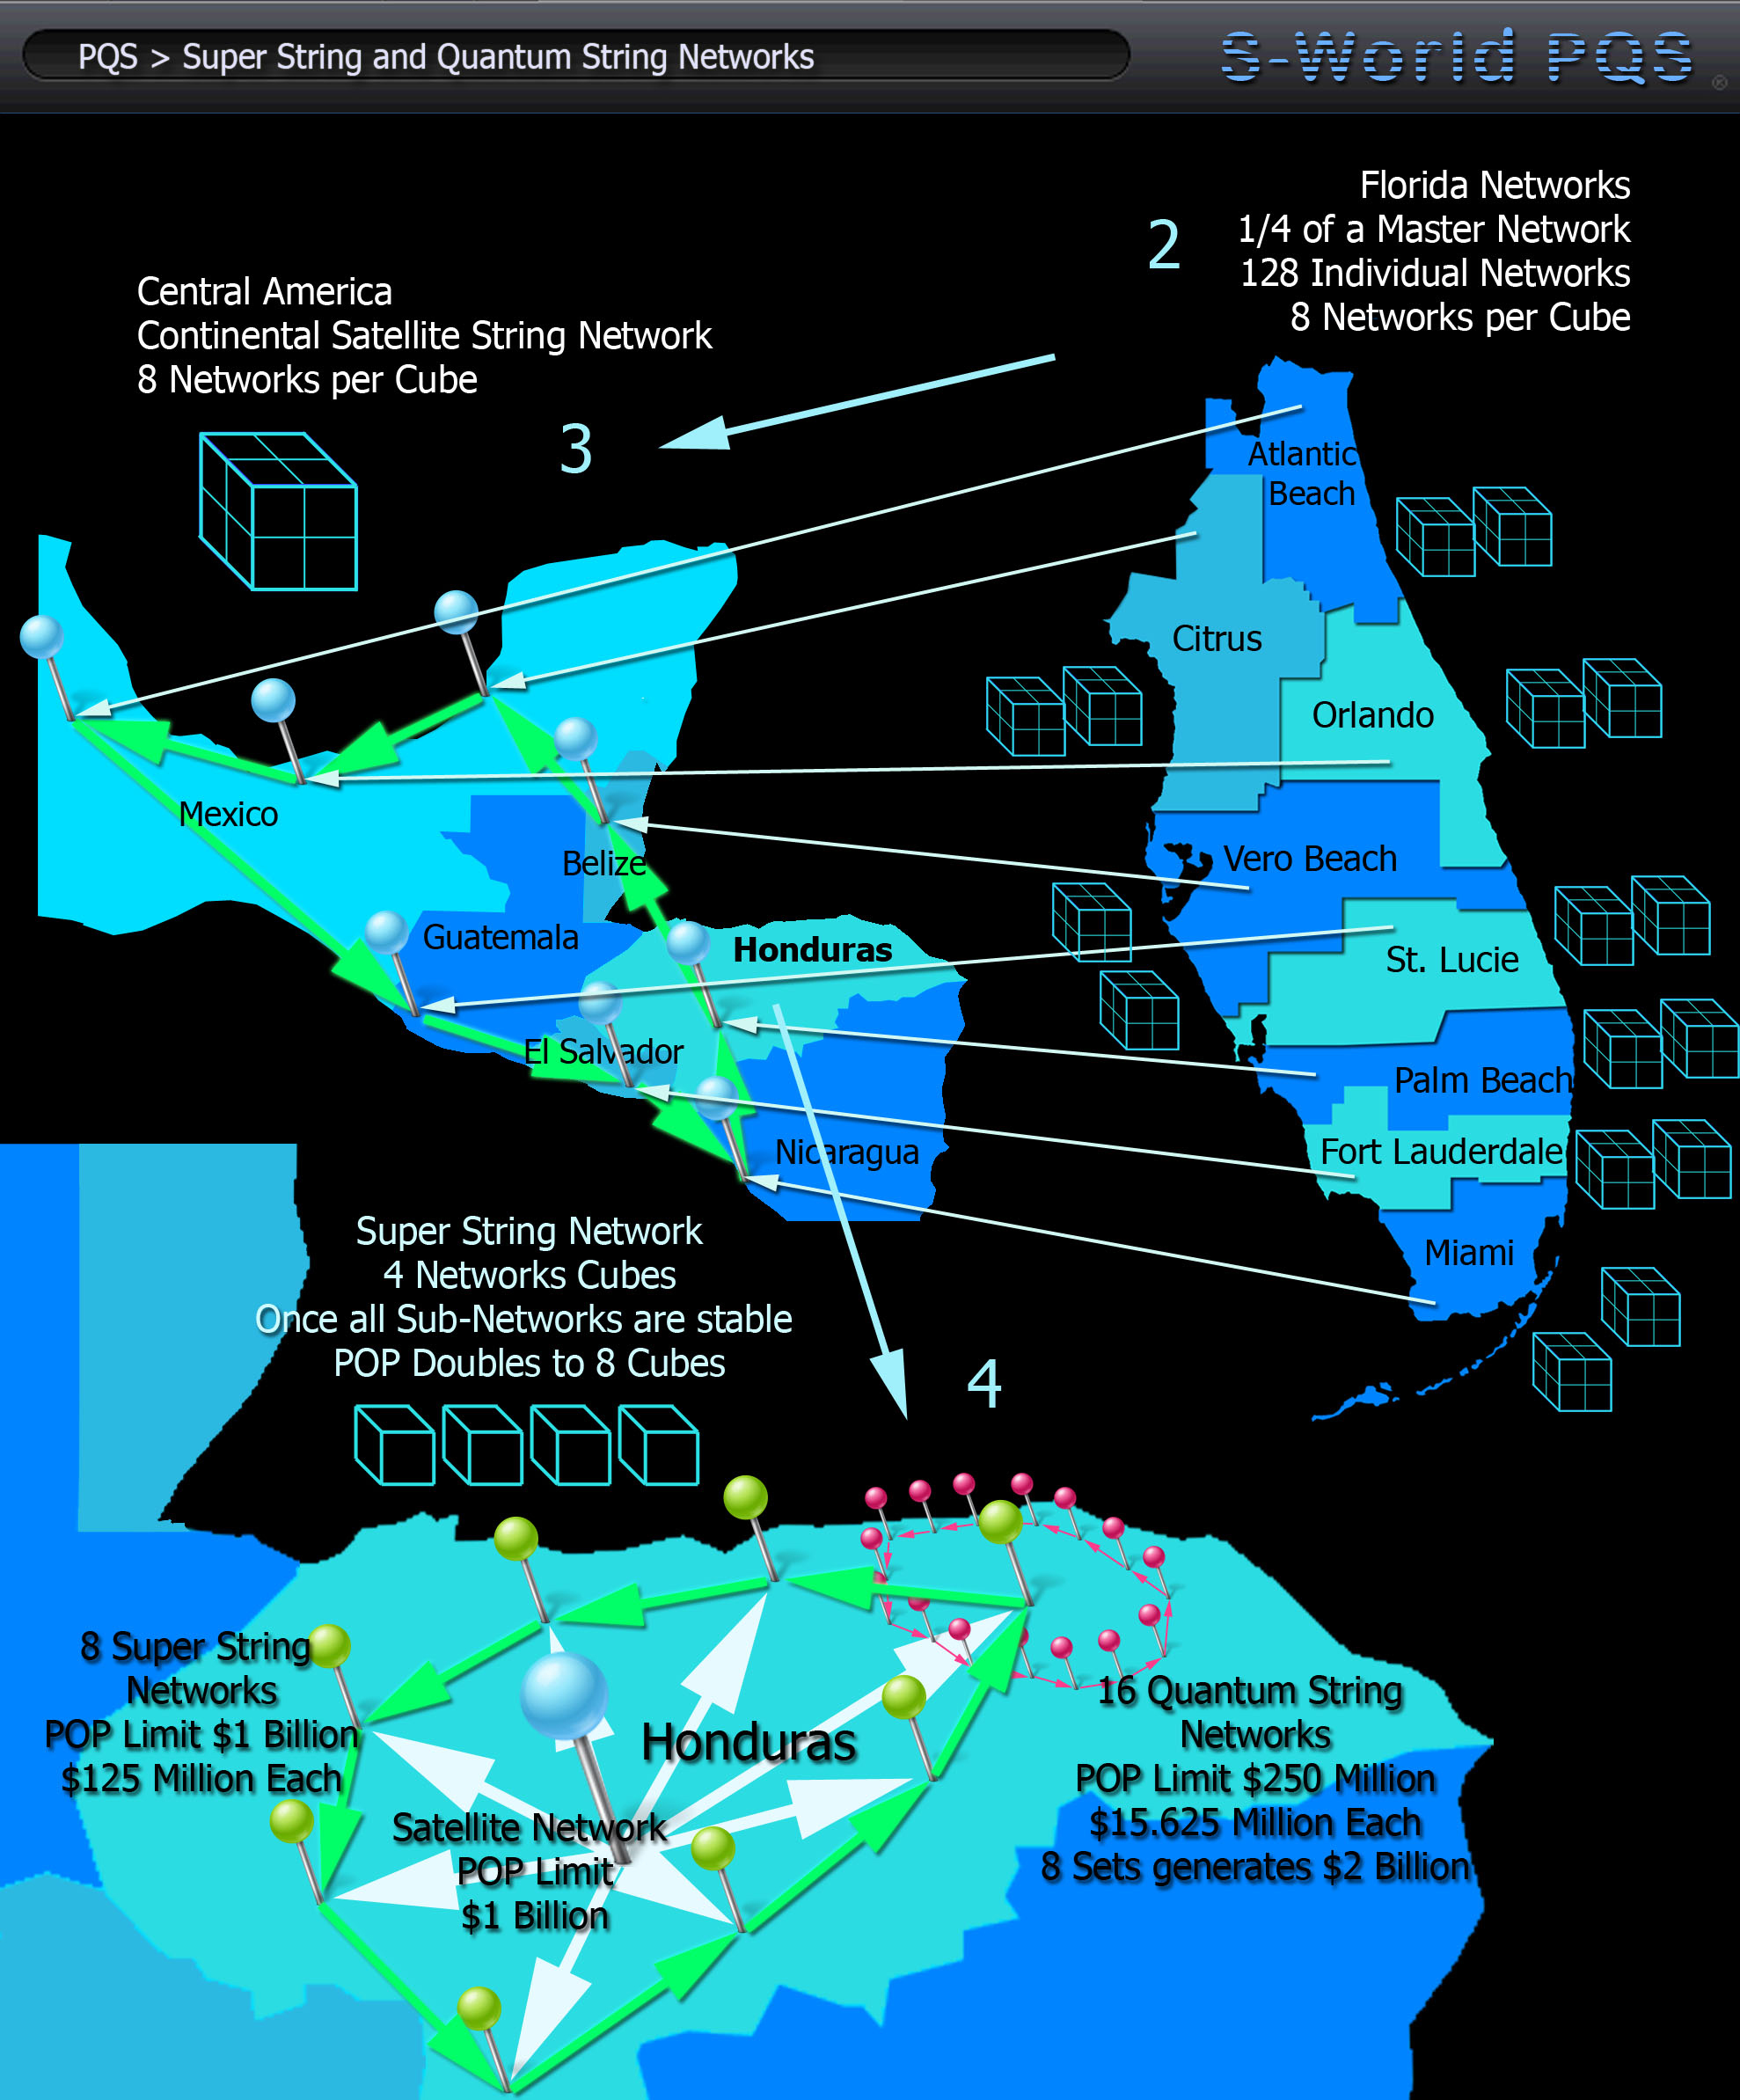
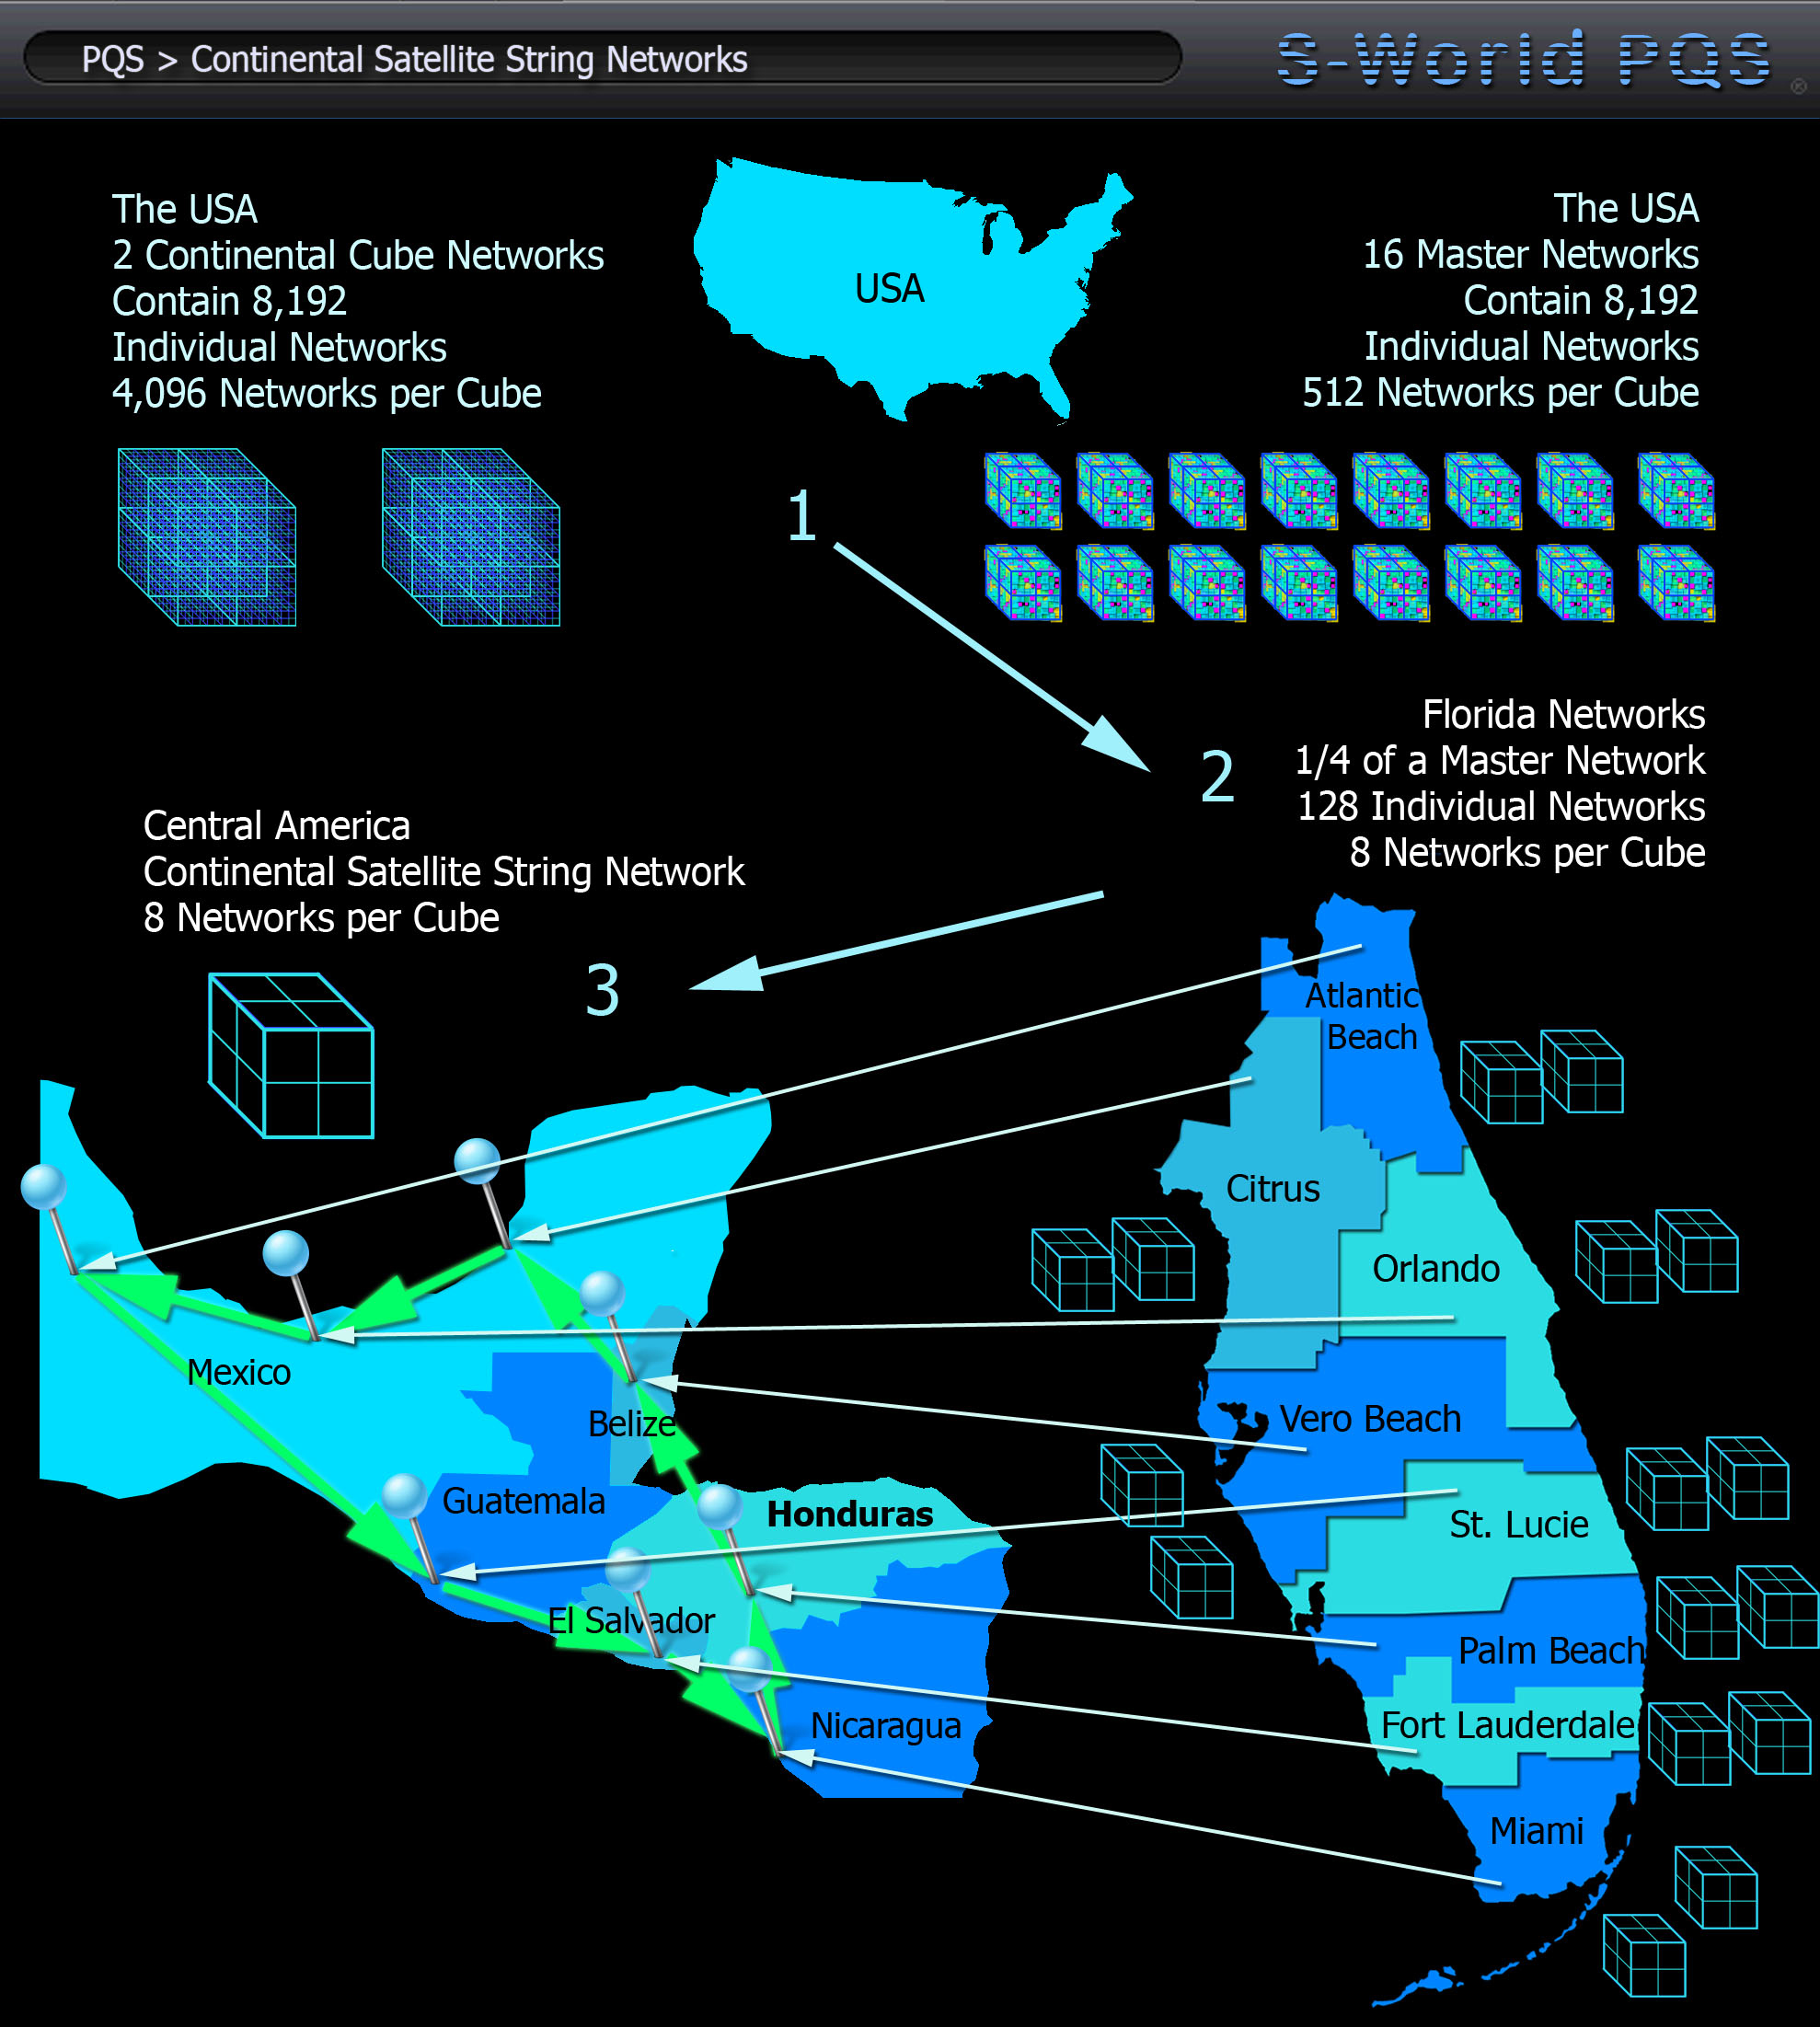
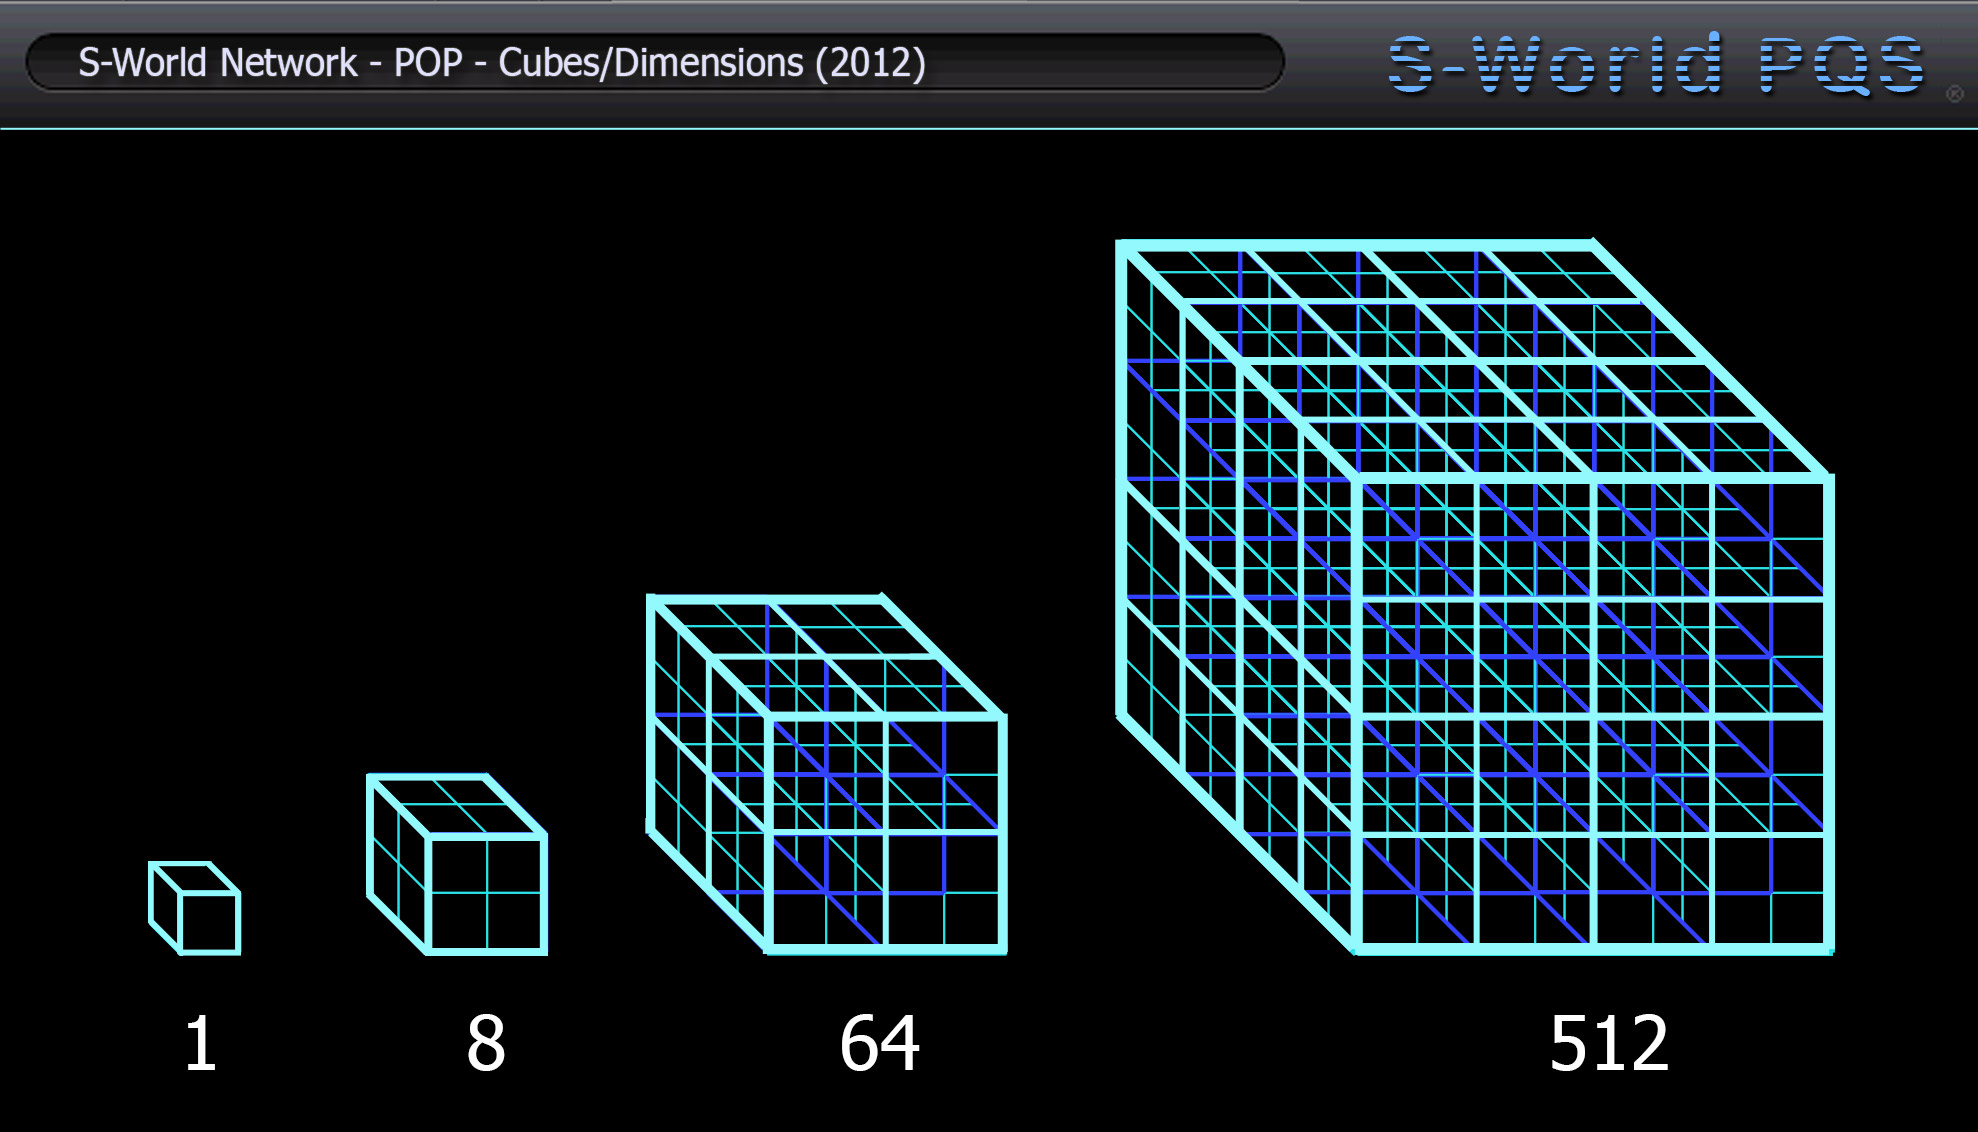
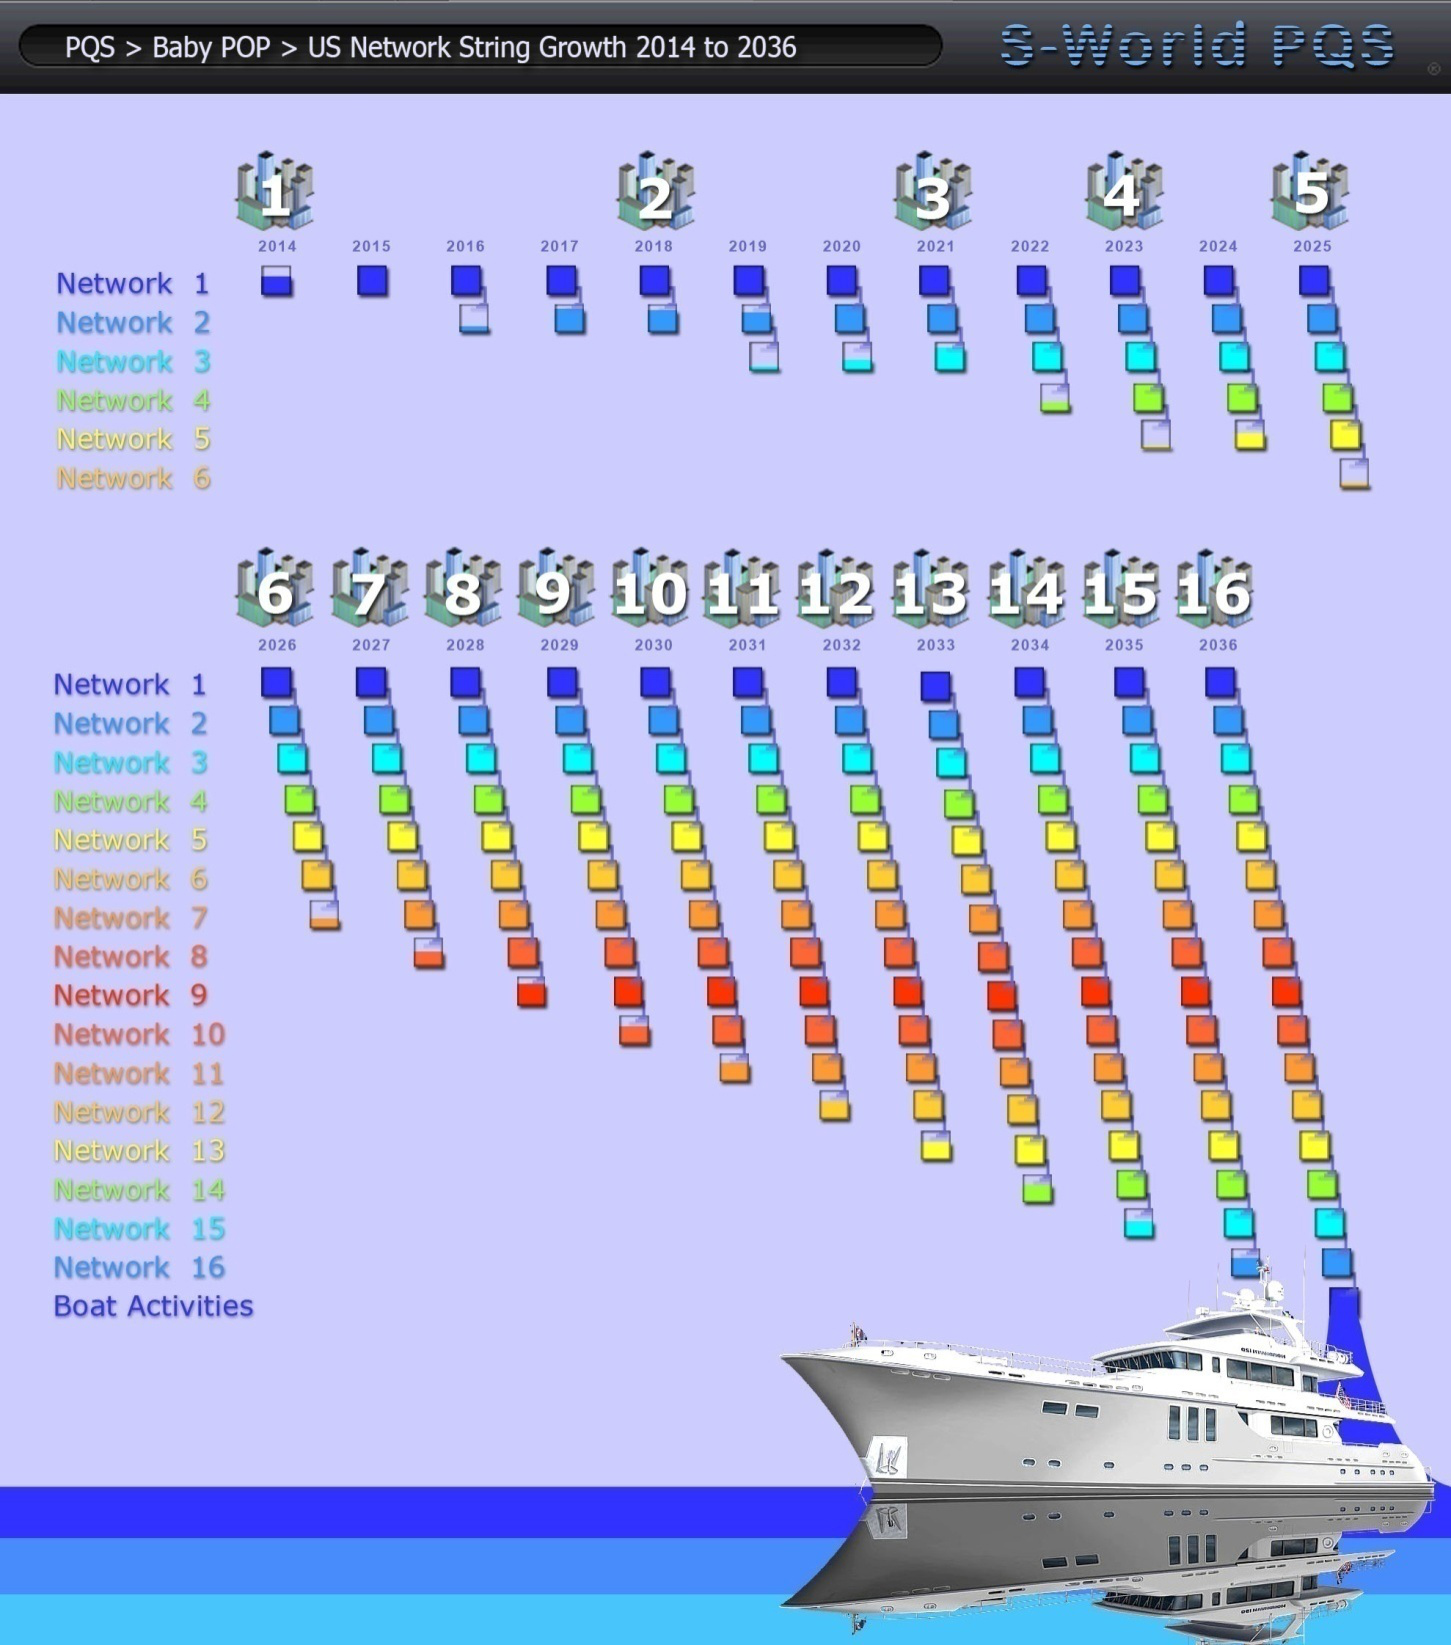
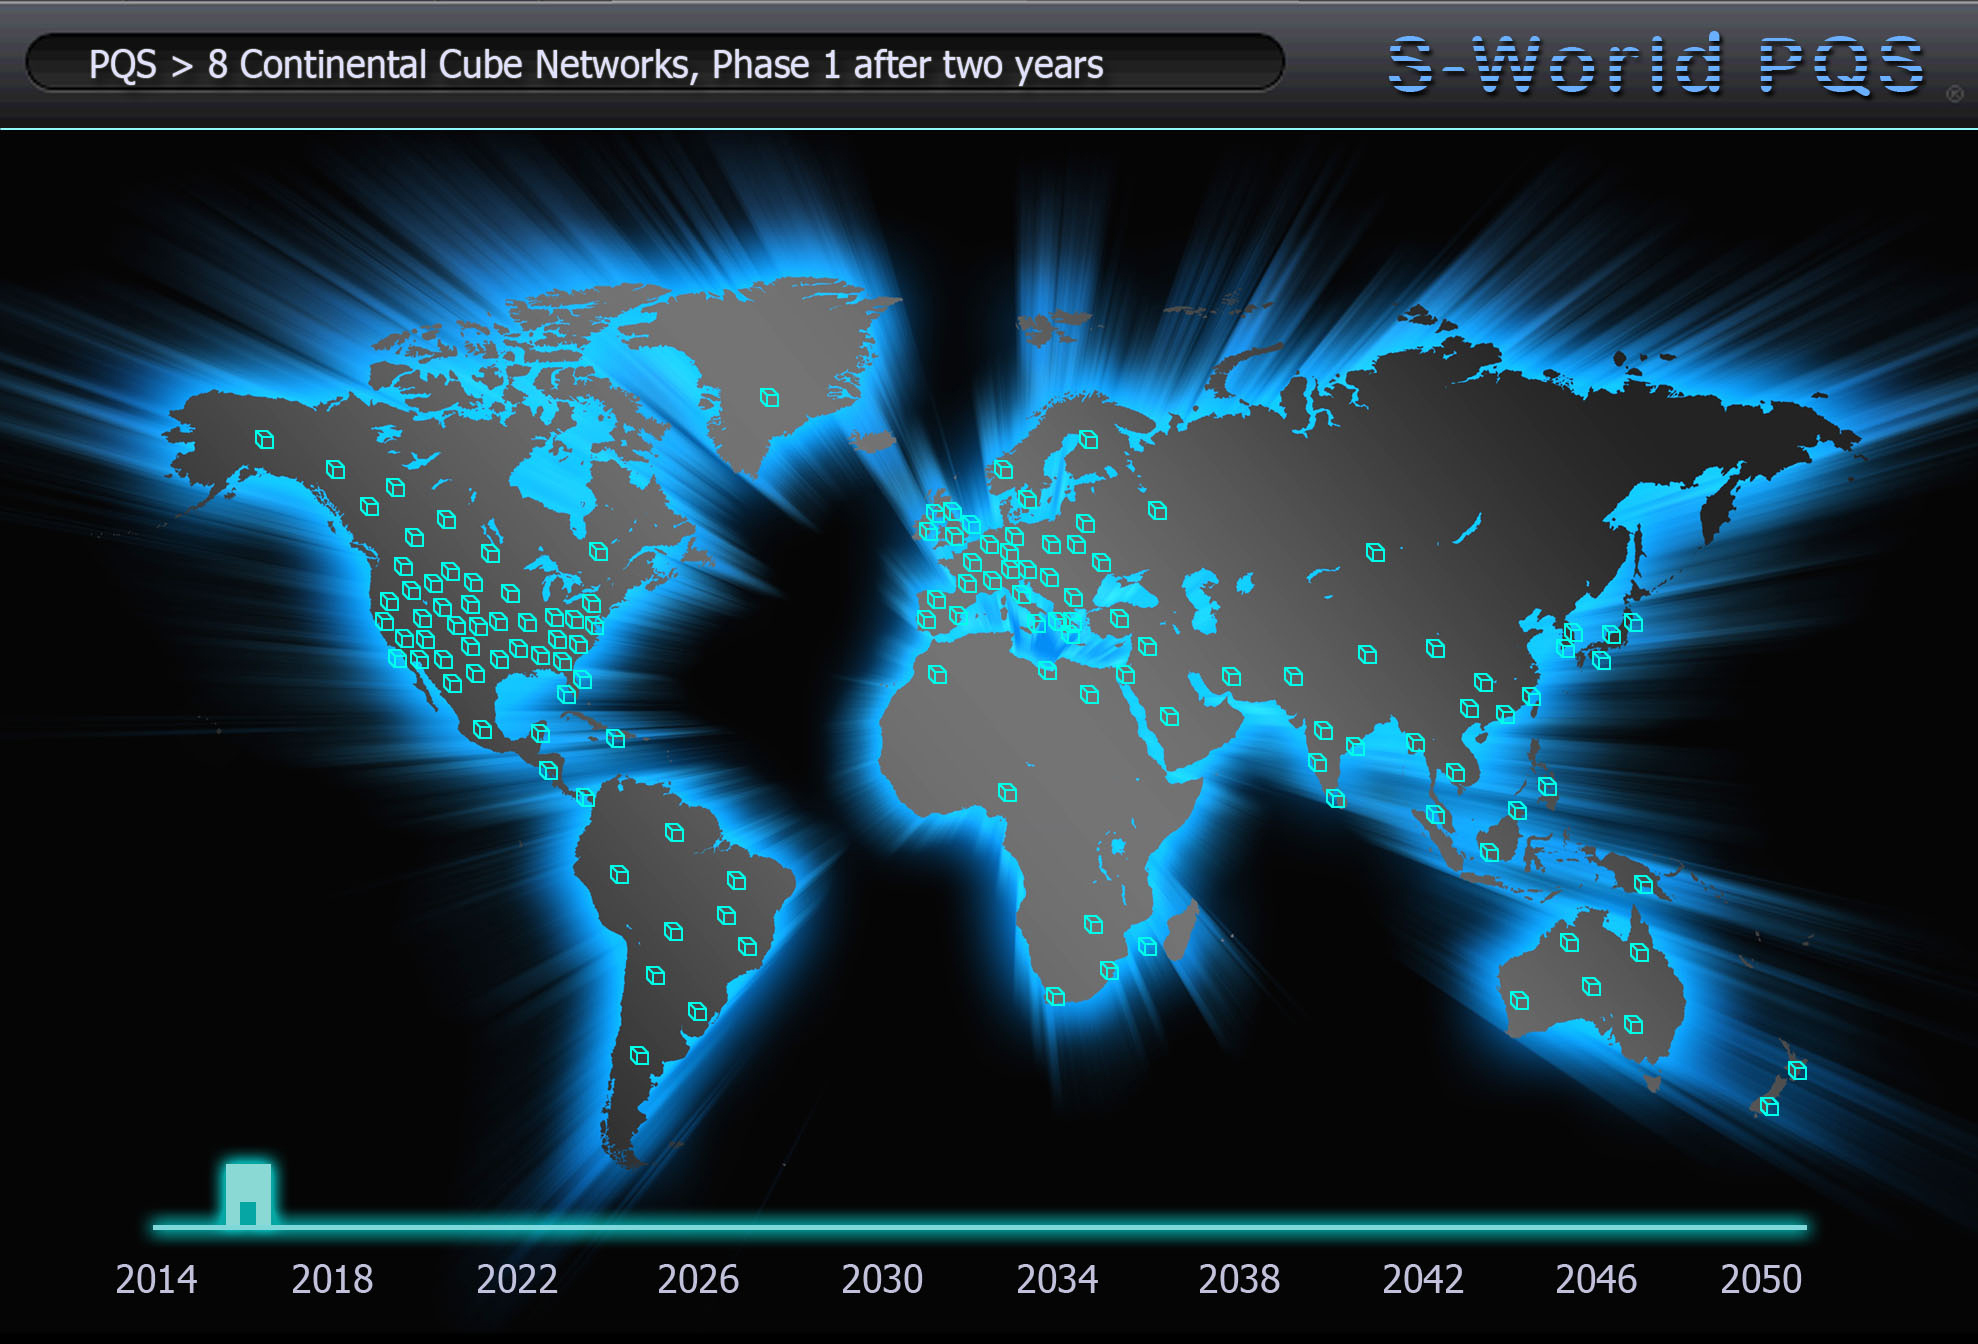
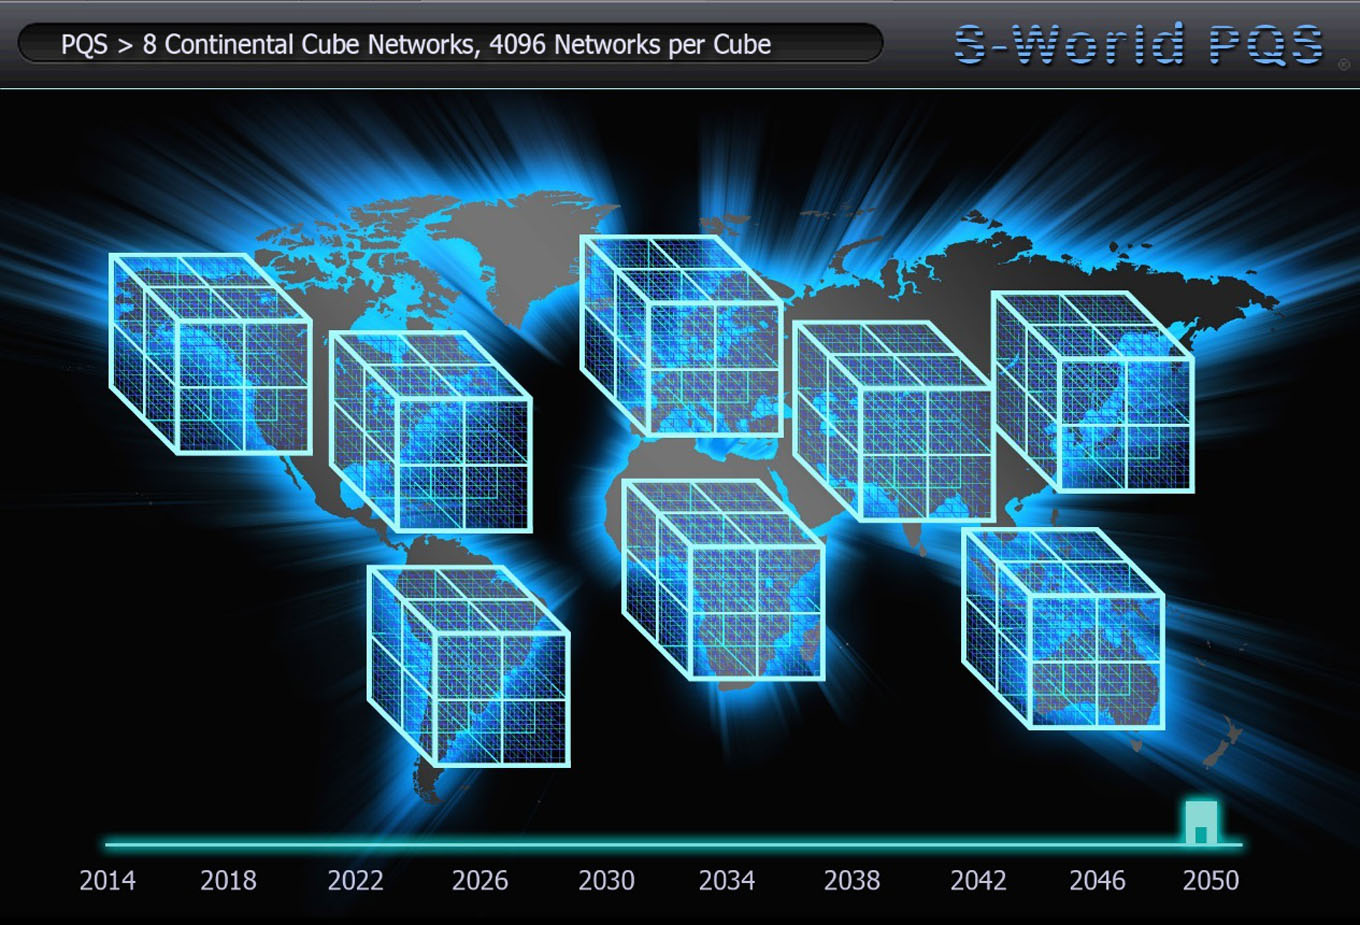
The objective was to show all the post 2036 USA networks in one graphic, where as soon as the networks and then their strings became stable they grouped themselves into cubes of 8, 64, 512 and 4096.

pop-us-networks-pop-forecast

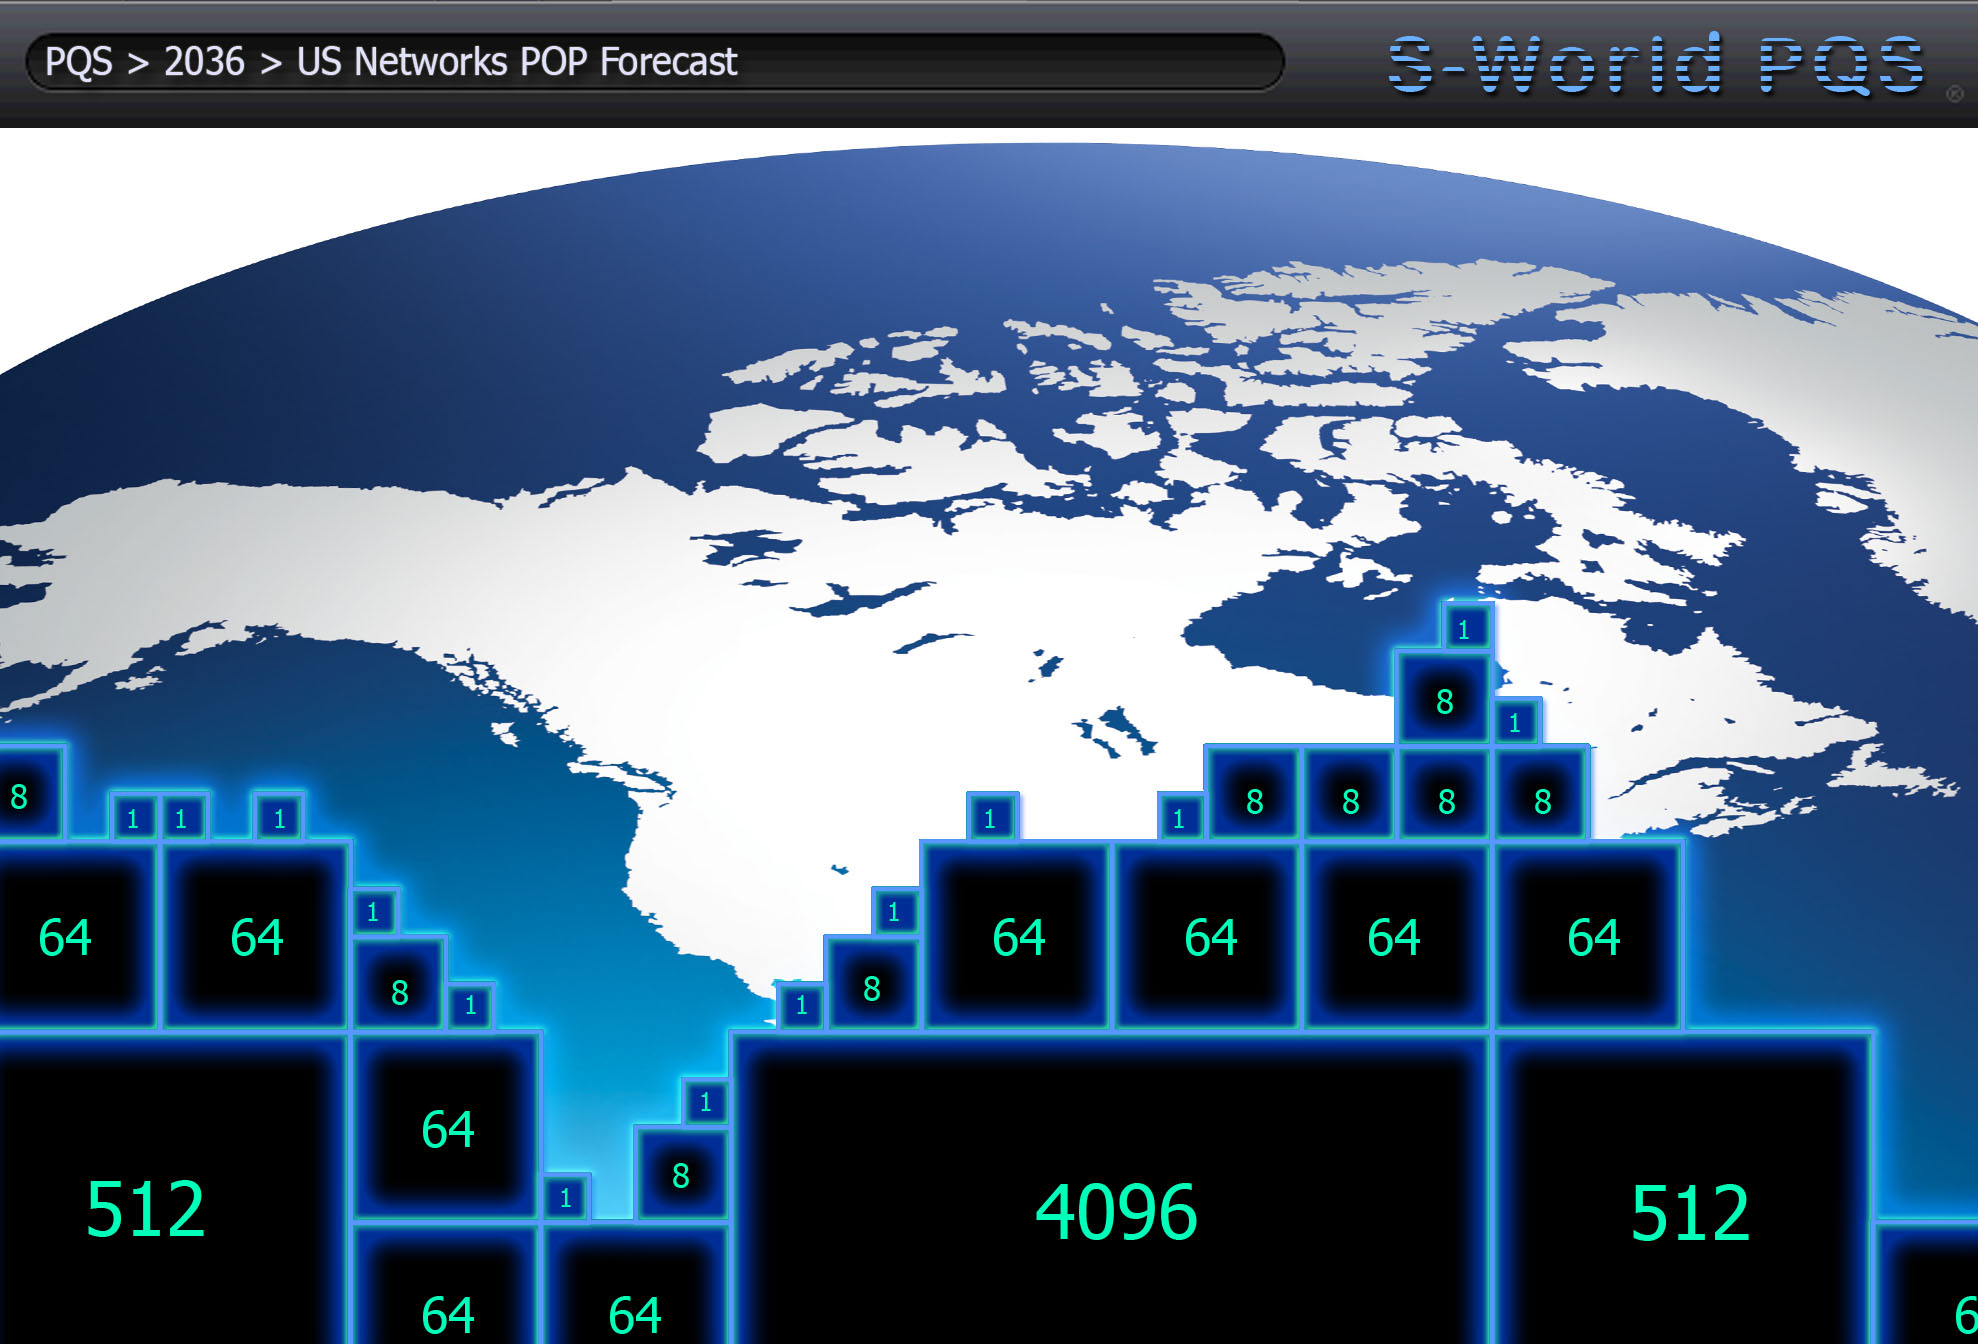
Practically this graphic did not work, as the visualisation needed to be in 3D. The boxes needed to come out of the USA map and there needed to be a provision to see holes in the larger cubes where unstable networks were. It did however present a starting point for looking at POP growth over time.

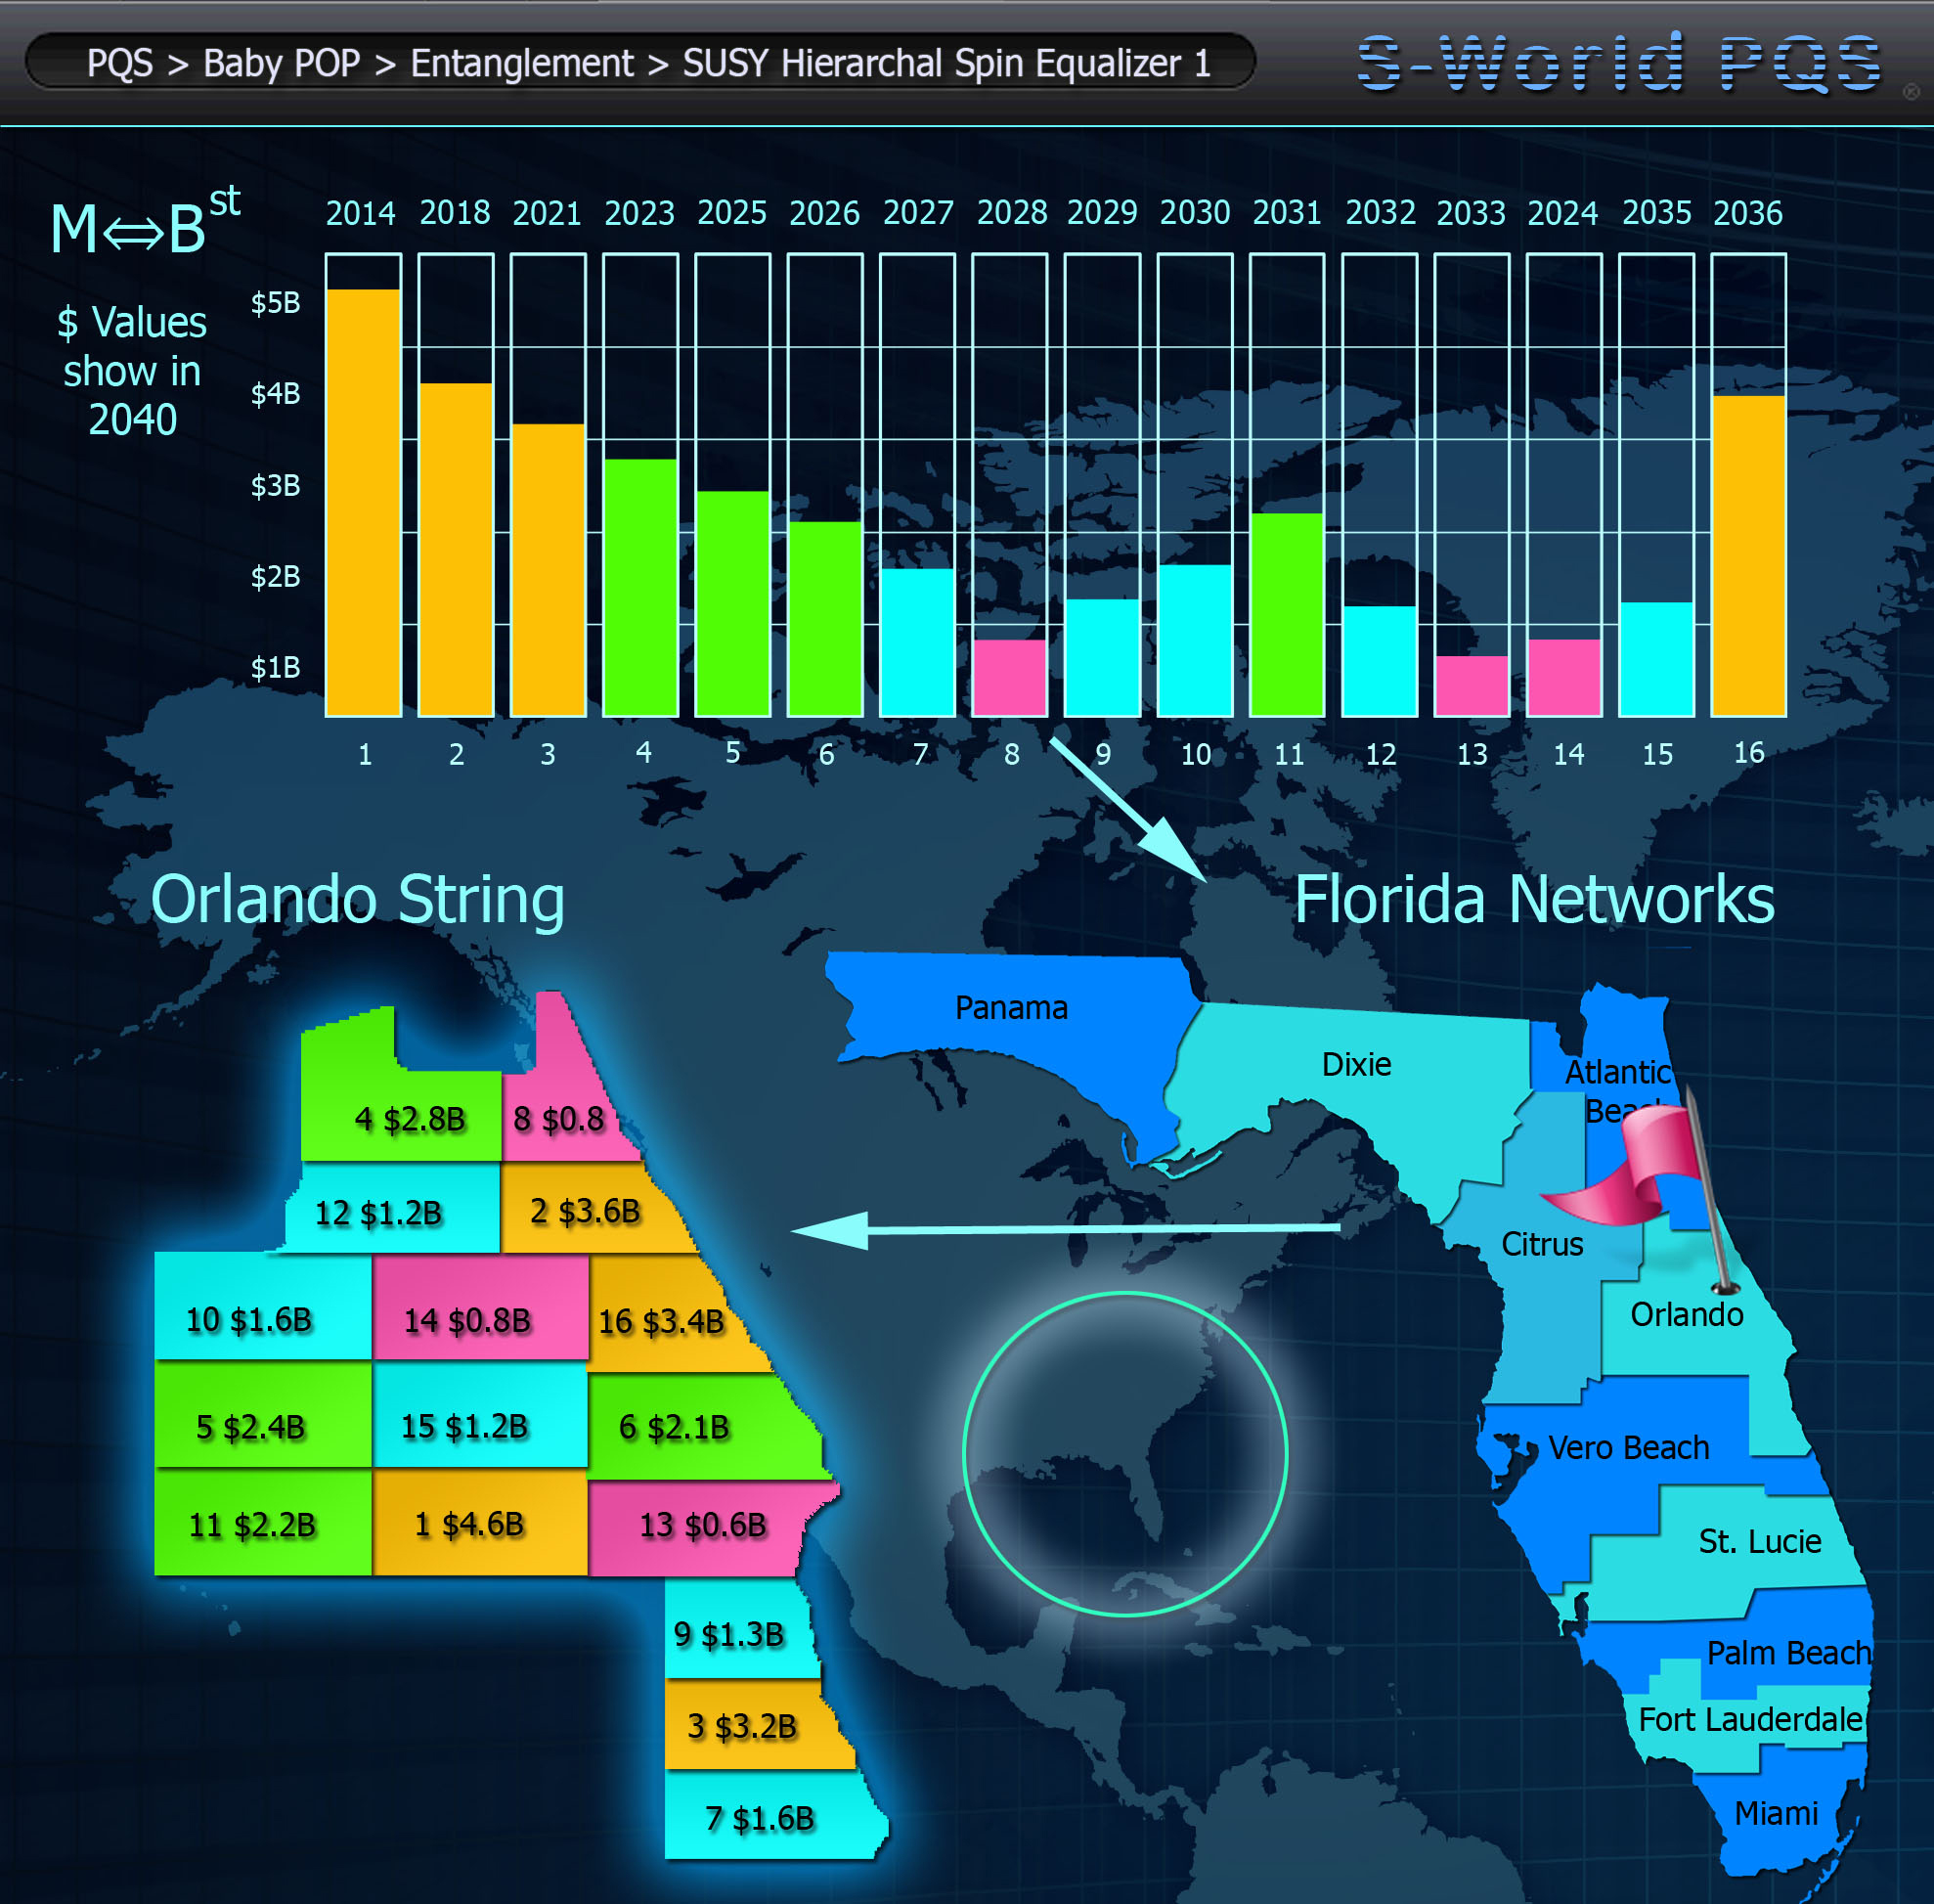
The concept was, and still is, to be digitally rendered within a hologram, which can be navigated by the human hand, as seen by a sensor. With a time slider so one can visually move through the years, seeing each new network appear within the cubed structure, as and when they are forecast to become stable.

At the same time as this graphic was being considered, in March 2012 I watched two documentaries in short succession. The first program was on physics. The documentary highlighted an important mathematical detail in regard to unifying Quantum Mechanics and General Relativity within the measurement of Black Holes and the Big Bang. The reason the two sets of figures will not marry was due to results leading to an infinite number.

“Quantum Force Theory” was a simple adaptation of CFM and POP applied to the problem of the infinite number. I considered it from a mathematical vantage point. If the experiment was run again, this time blocking any calculation that created a periodic recurring number and freezing any calculations that went passed processing power, and in a POP like manner, attempted to contain the numbers within the CFM cubed structure. The expected result may look like something like this:

pqs-black-holes-quantum-force-theory

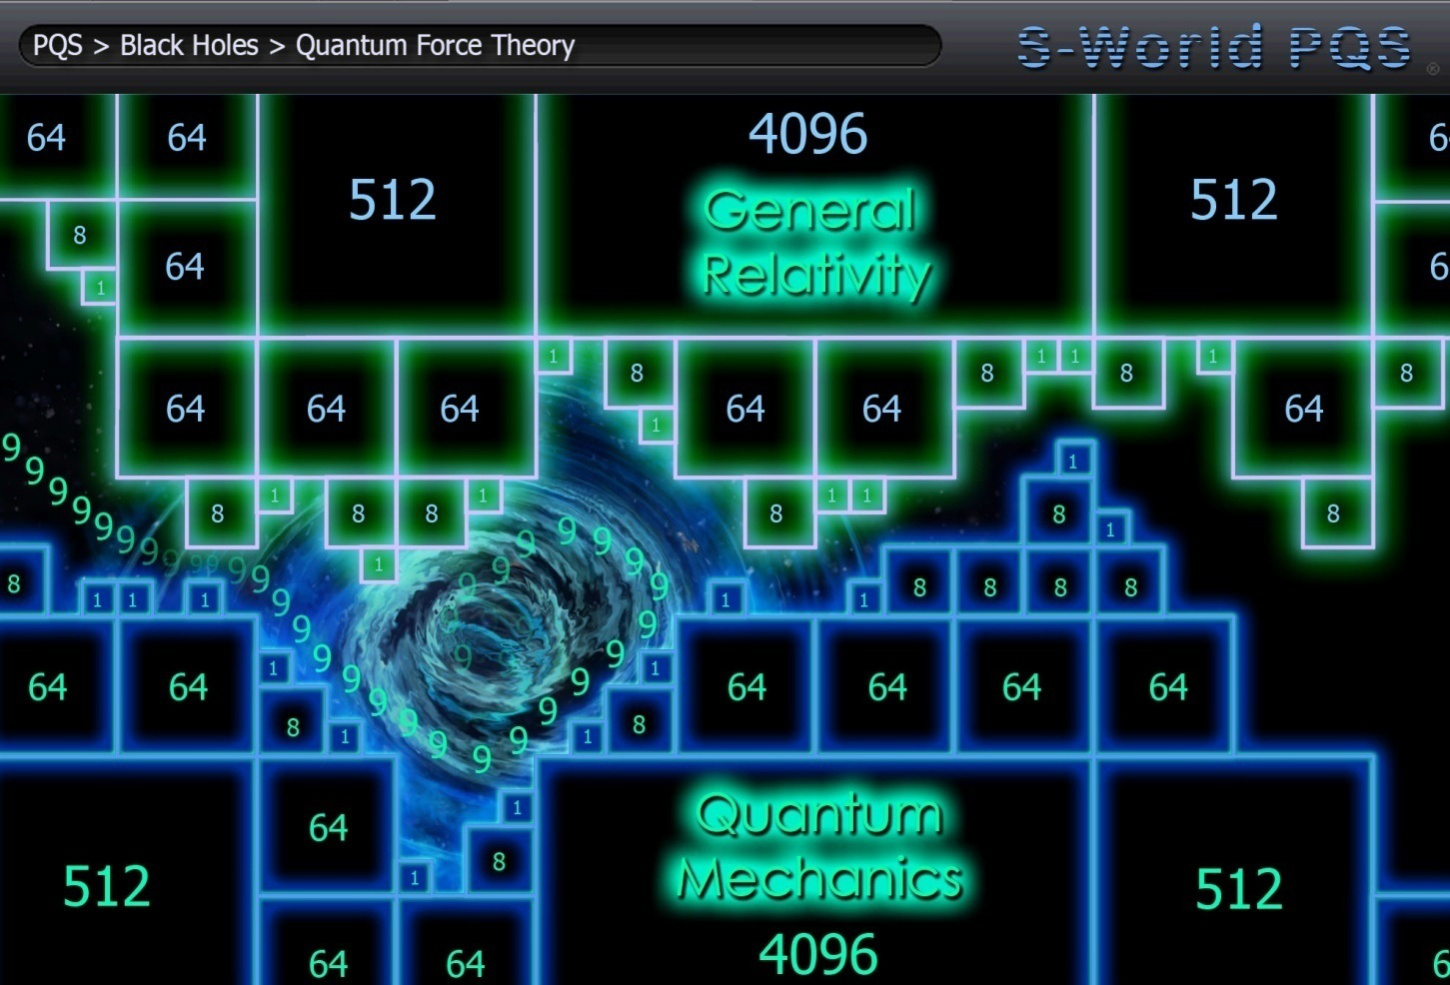
Looking as the problem from this perspective and from this vantage point, one can’t help but look into the gap. No longer was the problem within General Relativity or Quantum Mechanics, the problem was within the gap.

The graphic shows two definitive stable sets of mathematics and a gap of uncertainty. It was considered, “within this gap, something surprising might be found, maybe a force or frequency”, and so the theory was named “Quantum Force Theory.”

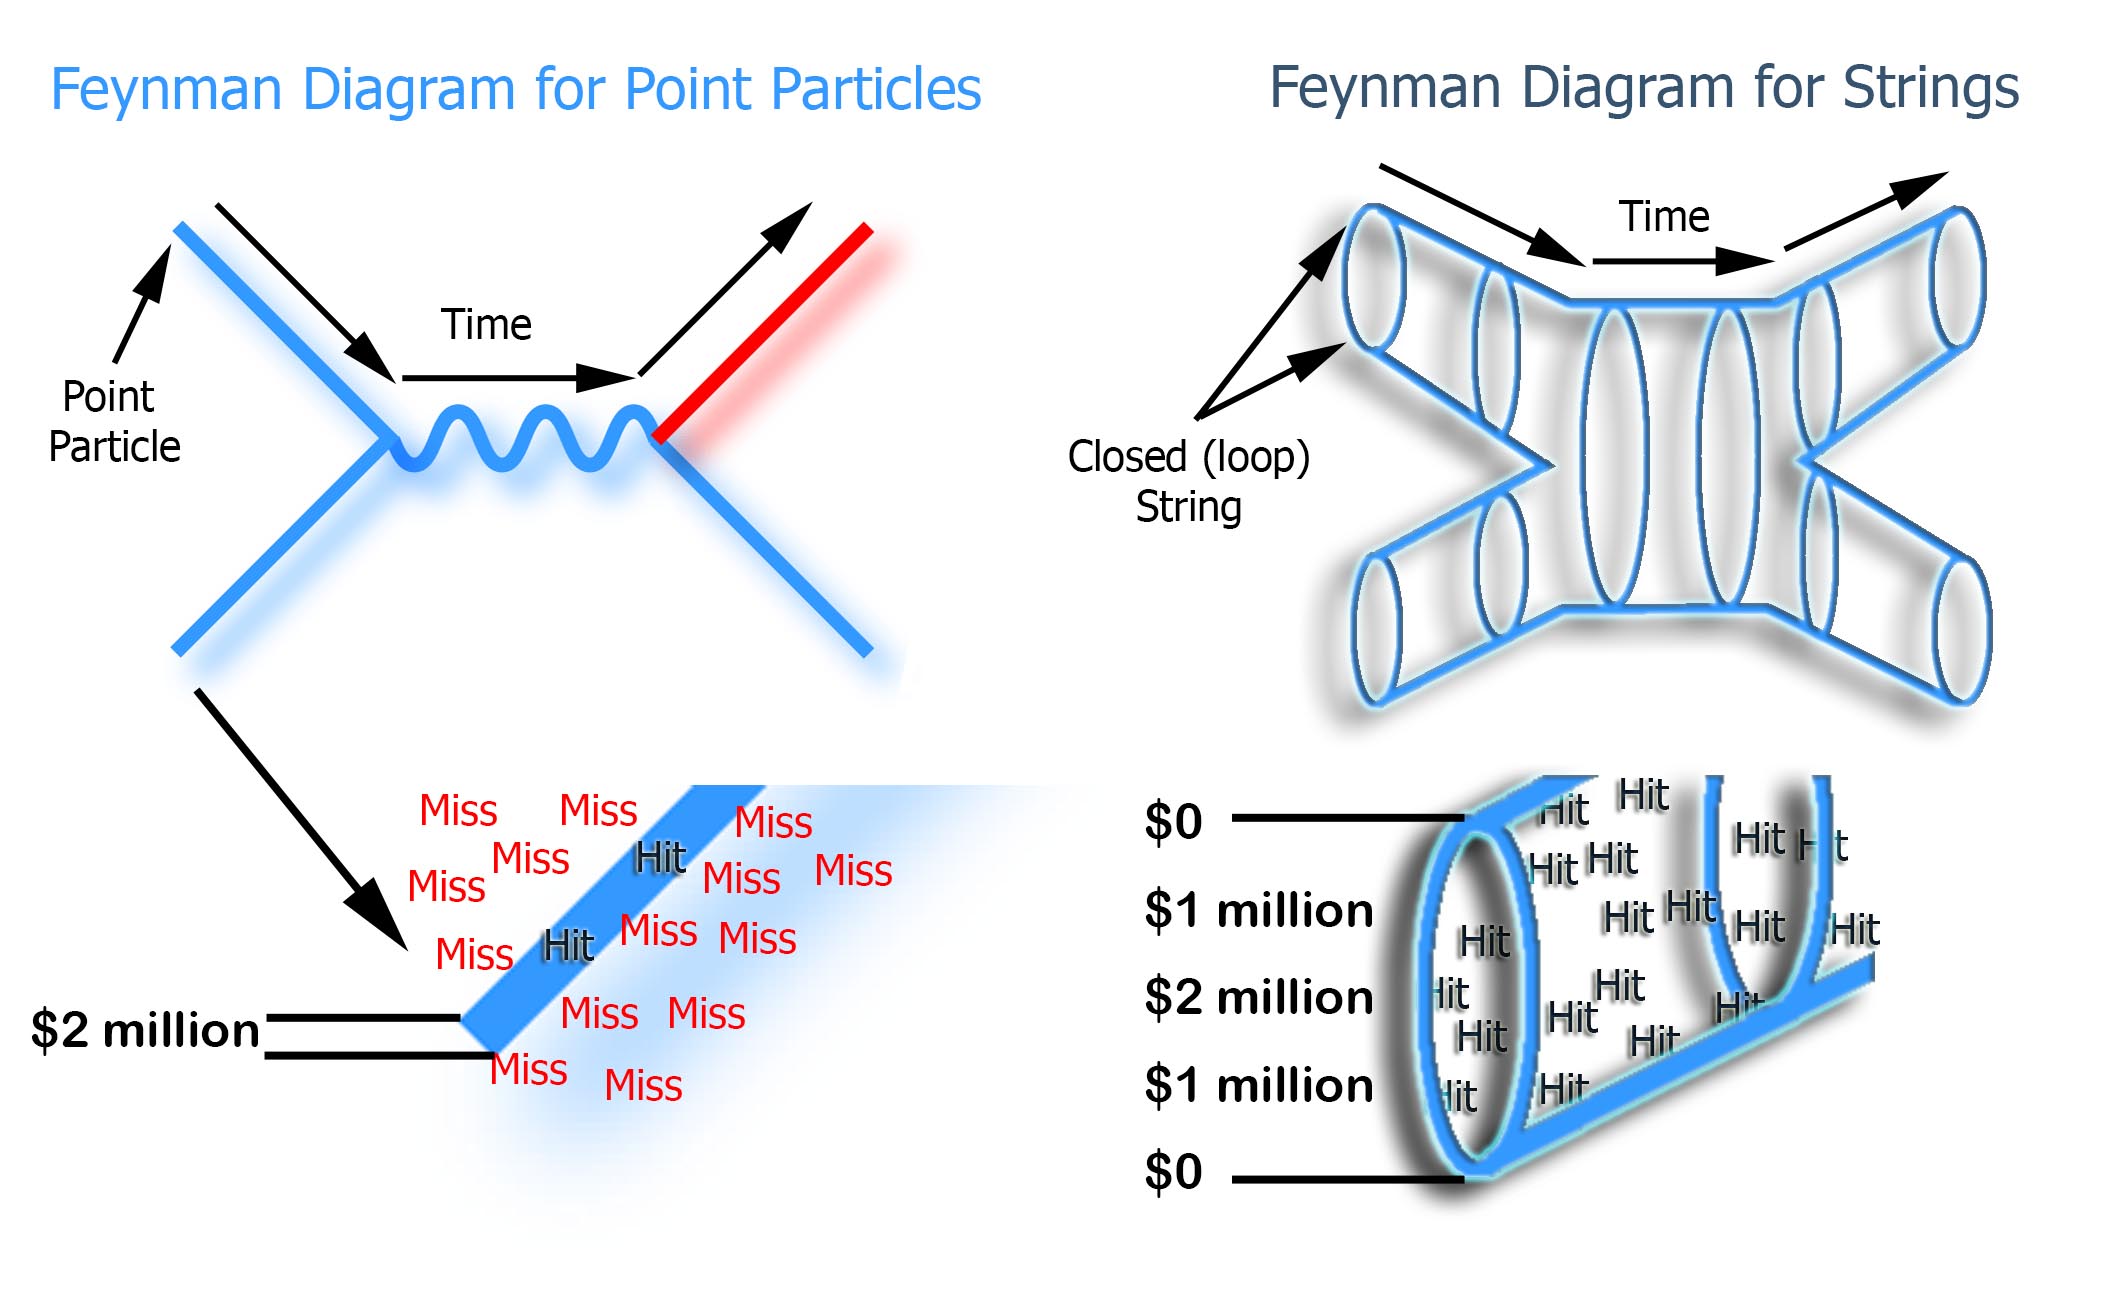
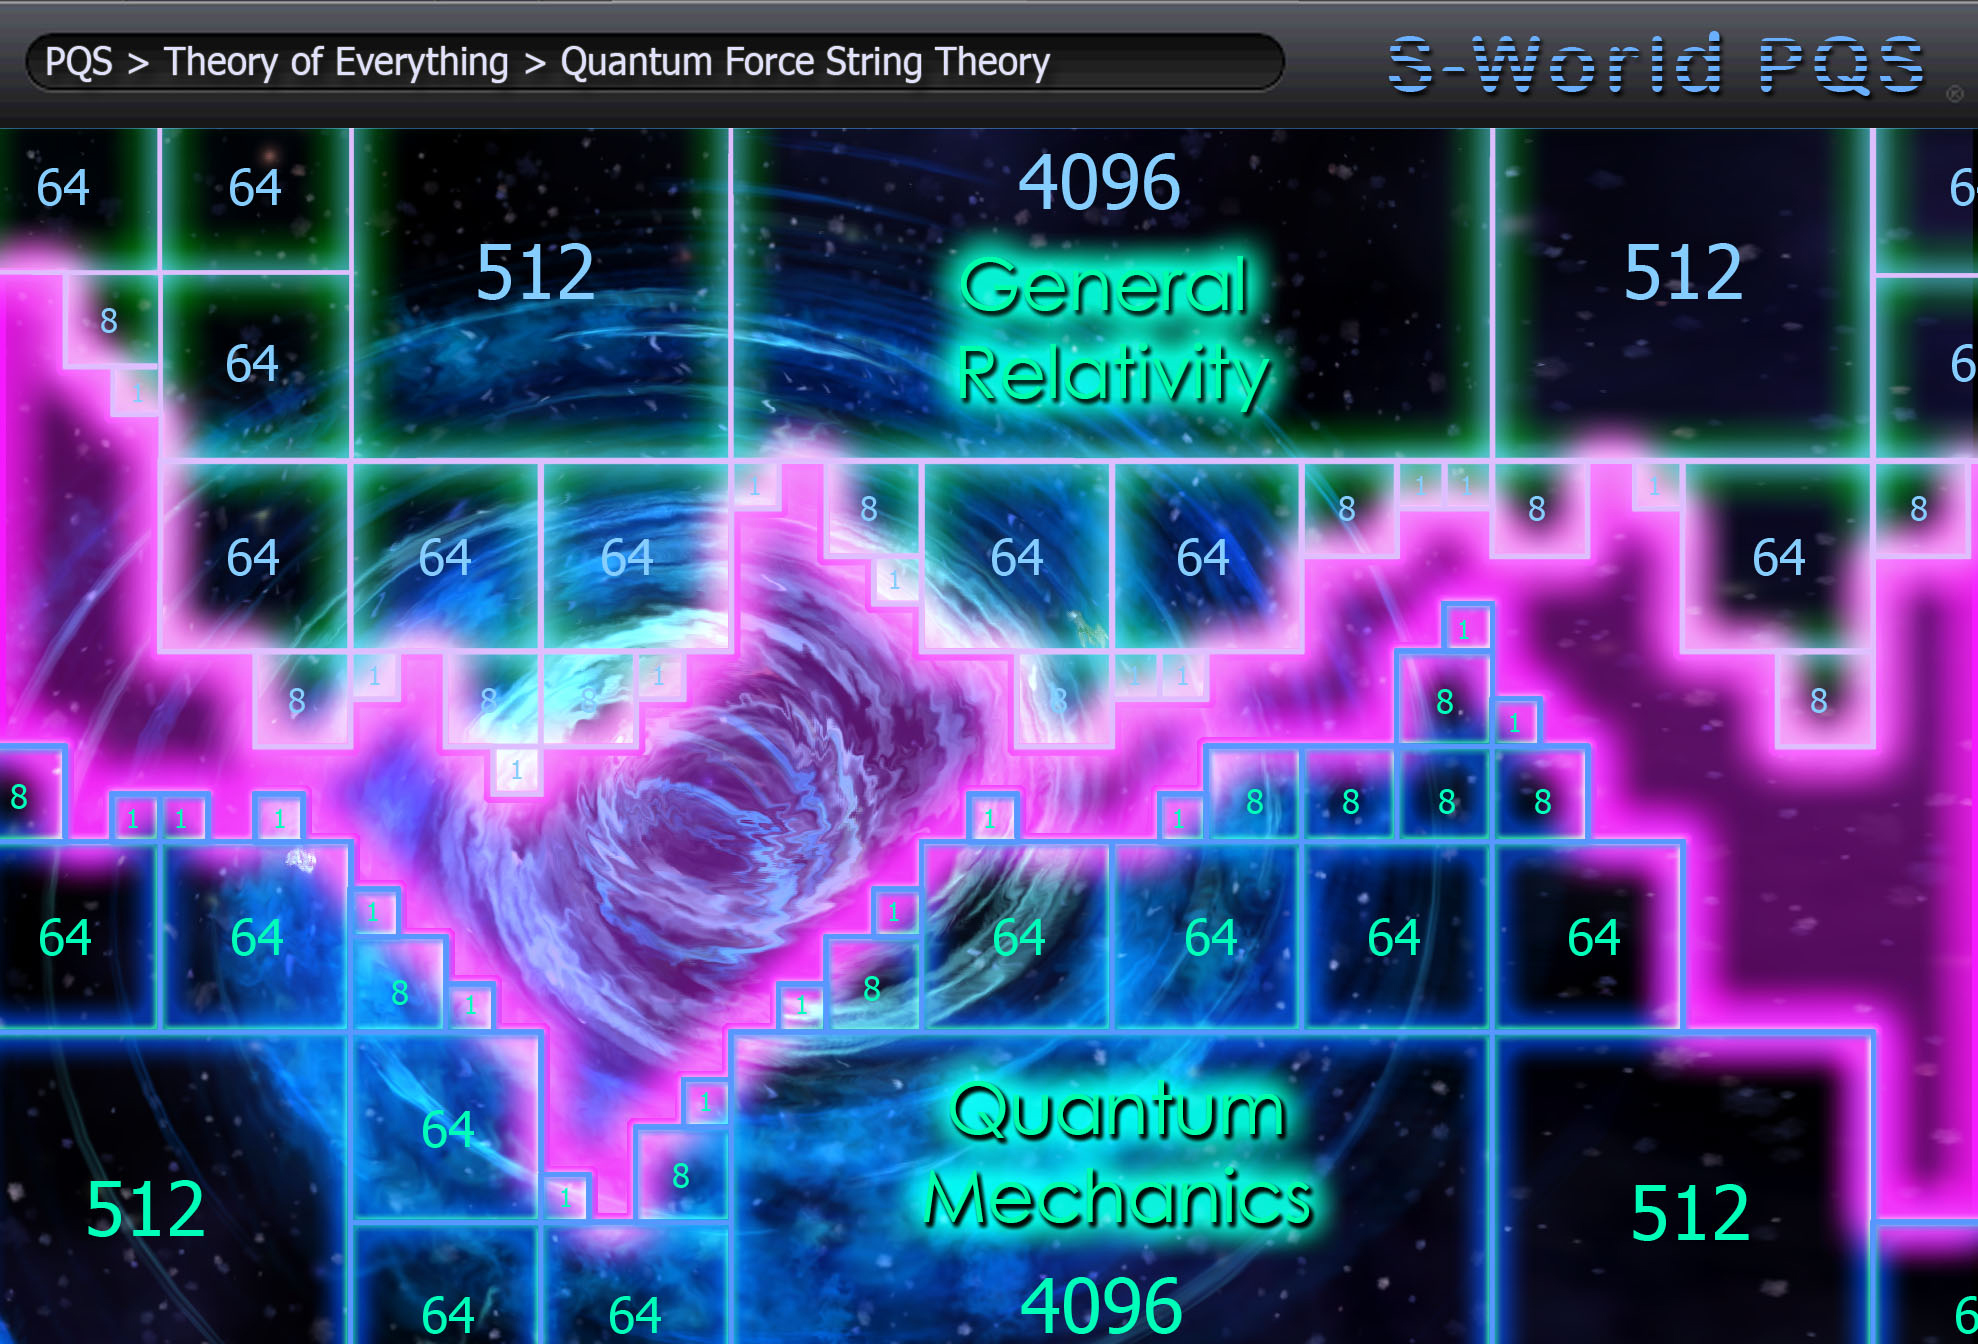
A question that sprung to mind was: “Is the gap String Theory?” To assist this contemplation, I created an additional graphic entitled “Quantum Force String Theory”

pqs-quantum-force-string-theory

In the here and now with the help of Dr Amanda Peet, the Quantum Force Theory graphic would appear to be incorrect. As when computing the probabilities of gravitons (the particles that transmit gravitational force) scattering off one another, we discover that the energy required, grows with the square of the energy. So if you double the energy, one increases the probability by four times and if you triple the energy one needs to multiply the probability by nine times. At very low energies, this is fine, but at very high energies as would be found within black holes or at the creation of the Big Bang eventually the probability would exceed 100%.

This being so, the Quantum Force Theory graphic should see the quantum calculations overlapping the ones from general relativity. This said there is a possibility the string theory graphic may be correct when the extra 6 dimensions are factored in.

Correct or not, having created the graphics and enjoying the experience with the practice of identifying the gap on my mind, when by coincidence the next day a Newsnight programme on economics in part blamed the financial downturn on governmental economic black holes. The idea of “analyzing the gap” within an economic black hole led to the consideration: If POP and CFM techniques could identify the problem area within the search for gravitational unity within an astrological black hole, the same principle could be adapted to work for an economic black hole. If the problem area could be identified and quantified, it could be tackled and reduced.

On consideration in network terms an economic black hole simply became…Money that left the network.
Fortunately, much work had already been put into doing just that. In particular the financial software dictating the ordering process, so companies within the network could only order (except in exceptional circumstances) from other companies within the network.

Economic Black Holes and Quantum Economic Efficiency Scores

Not long after, Baby POP was discovered and the “Suppliers Butterfly” was written into “The Theory of Every business,” highlighting the various advantages the network offers including the guaranteed tenders as provided by the M⇔Bst.

The general thinking in relation to tenders was that collectively each Resort Network would see about $2.5 billion in construction costs. The objective was to minimise the money that went missing, maximising the profit vs. revenue of each company, alongside the companies it purchased from. Whilst remaining competitive and allowing generous profit share for the staff. Profit share that was to be paid in “network credits,” and as such, alongside all orders made by network companies, all profit-share would be destined to stay “in house.”

Direct salaries were the hardest to contain. This problem was later addressed within the design for S-World UCS, which we will take a brief look at in a moment.

Staying with the basics for now, below is the 2018 Window Factory “Suppliers Butterfly” QE Efficiency spreadsheet, (the “E” being the “E” within the RES Equation).

Looking at the spreadsheet below, firstly In row (c) we find The Window Factory’s “Profit vs. Revenue” ratio is 30.8%, this figure is the total company profit from row (b) $2,441,125 divided by the total company revenue in row (a) $7,938,477.

add_spreadsheet

Next we follow the rest of the money which equals $5,497,431 and look to ascertain how much of that goes to network companies and how much leaves the network. At this point we are no longer looking at the profit vs. revenue ratio of an individual company, rather the profit vs. revenue of all companies benefiting from the initial Window Factory revenue of $7,938,477.

We call the combined profits made from the Window Factory and all suppliers and staff spending on networks “Quantum Economic Efficiency” (QE Efficiency).

For this exercise, with the exception of staff, we have estimated all suppliers’ companies have a 54% QE Efficiency.
As such in row (d) we see the $3,175,391 spent on suppliers, is multiplied by row (e) the 54% QE Efficiency of the suppliers. Which in row (f) generates an additional $1,714,711 in profit for the network. Which when added to the initial $2,441,125 made directly by The Window Factory equals $4,155,836. When this is divided by the initial revenue of $7,938,477 an overall QE Efficiency of 52% is attained.

Added to this comes some smaller contributions from media companies, staff and miscellaneous spending. The eventual tally of $4,657,526 gives The Window Factory a QE Efficiency of 58.9%, as such, for every dollar spent at The Window Factory, the network, as a whole generates $0.59 cents.

As such, if this were an average result within all the building companies within a network, of the $2.5 billion that is to be spent on building, nearly $1.5 billion will be returned as profit. This is $300 million more than all the profits required from all companies for the first 3 years of the Baby POP spreadsheet. Every cent created by the remaining 87.5% of companies would be additional profits above target.

Staff QE Efficiency encouragement

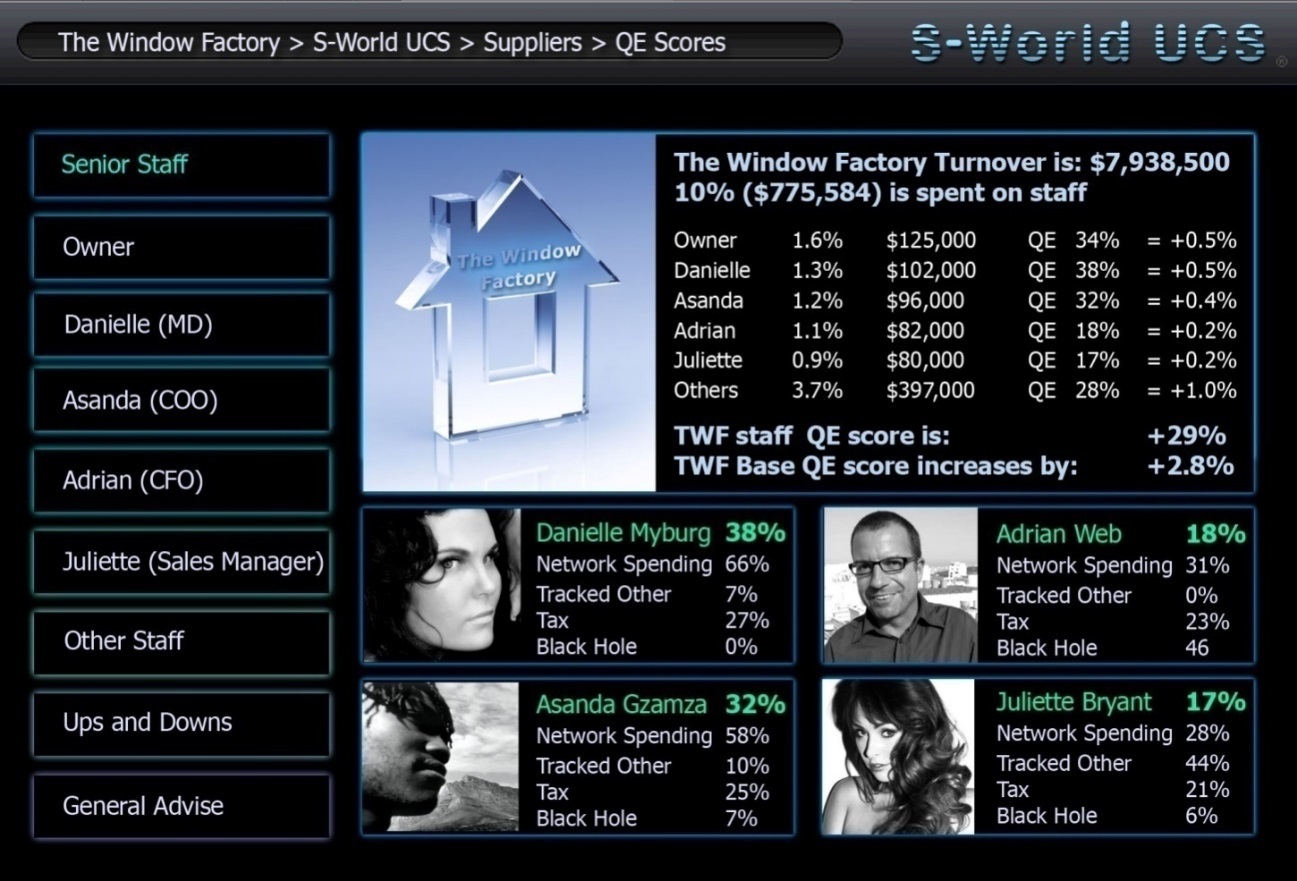
Money leaving the network via staff is the hardest to contain. Without getting overly detailed, the screen shot to the right for S-World UCS illustrates how staff is encouraged to attain high personal QE Efficiency scores. The bottom line is, when it comes down to payment of bonuses and profit share, (which by 2018 would be approximately equal to their basic salary), the higher a staff members QE score, the more they will receive of this bonus pot.
The figures below are worked on all staff receiving the same basic salary. But as 66% of Danielle’s spending is spent on network items, where as Juliette only spent 28%, this being so, Danielle receives a combined salary and bonus of $125,000 compared to Juliette’s $80,000. And in doing so, encouraging and incentivising all staff to spend their salary on network items.

In reality, the actual difference in bonus payments to staff due to their QE score would not be quite as severe, as performance statistics are considered alongside EEE Points, which get awarded for doing things that benefit the network and/or the planet.

There is however a significant incentive for staff to wherever possible spend money within the network. Particularly when it comes to property, as for many that would be their greatest single financial purchase. When we consider the butterfly, cause and effect logistics; this initiative will add significantly to the desirability of purchasing network built properties.

(Note 1: A word on the math in the graphic, we see Danielle spends 66% of her income, but only has a QE score of 38%, this is because her network spending needs to be multiplied by the QE score of the companies she purchased from, in this case an average of 58% was used. 66 x 58% = 38%.)
(Note 2: This example is a small demonstration of how attempting to improve game play in S-World UCS, created a useful parameter that could be applied to the day to day workings of the network.)

M_Systems_-_A

It’s difficult to judge exactly what the economic black hole is within the USA, or indeed how you would exactly quantify it.

We do know the average Fortune 500 companies generate 7.5% in profit compared to what it takes in the tills. And it would seem the average small business in the USA makes between 5% and 15% profit. But what that equates to as a QE score is incalculable. There is no way to track the money through the current system with any degree of accuracy. All that can be said with certainty is it would be significantly lower than the collective businesses within the network.

The RES Equation: RES>=+100%

Technically the RES equation was created to answer a question: “If the network were to become the hub of world trade, at a fixed network profit vs. revenue (QE) efficiency of 75%, how many times will the revenue need to circulate within one year to create growth?

The equation: R (Revenue) x E (Efficiency) x S (Spin) must = over 100%: RES>=+100%
(the > symbolising “must”)

However, whist exploring the mathematics it became clear that given the controls within the network system, the RES equation could be used to continuously stimulate the network economy. In essence giving the benefits associated with the M⇔Bst equation in terms of additional trade to all network companies.

As a further advantage, presented correctly, it would give a clear cut example of how the “Give Half Back” process when combined with “Economic Stimulus” generates more profit for companies than they have given back.
What we wish to demonstrate is the RES Equation’s ability to turn one dollar made in profit by any individual network company, into two, three, four or more dollars in the combined networks tills.

RES Equation Examples

Three examples of the RES equation are presented. First is a simple example of how profits can be doubled following which is the latest update to a continuing “work in progress” that considers RES within GDP. This example is presented as “let’s work on this some more,” not “this is how it is.” The concluding point is practical, specific to network profit centres.

RES equation example 1

To start with we look at a network (collection of companies) that has generated $1 billion in profit. And we assess what the (R) (Initial Input Revenue) would be if the companies combined QE Efficiency was 55%. Working the maths backwards we find $1,818,181,818 times 55% gives $1 Billion in profits, so we have $1,818,181,818 as the Initial Input Revenue. The R in the RES equation equals $1,818,181,818

Now we need to add the spin.

Using a starting profit of $1 billion and by ensuring profit is spent within 4 months, be it via POP, purchasing, network dividends, profit share or any other method of distribution, then the network will create an additional $550 million in profits, as $1 billion x 55% is $550 million. This is one Spin, (The S in the RES equation)
Next we repeat this process, so the $550 million is spent within four months, creating a further $303 million in profit. Lastly this $303 million is also spent within four months, creating a further $166 million. Adding up all the profit as a whole the network will have generated over $2 billion in profit.

add_spreadsheet

Where this leads to is a consideration.
Before applying RES, as long as a network can expect $1 billion in profit, by applying RES “in general” to the network, the network as a whole will have generated over $2 billion in profit, from the original $1 billion profit.
RES equation example 2 – the Big Picture (work in progress) (very important point)
Next we take a relativistic (big picture) example and consider a point in the future. Where the efficiency of the network has engulfed our current economic system and the network is by far the greatest contributor to Global GDP (Gross Domestic Product).

First of all, we need to define GDP, on the US Debt clock. The CBO (Congressional Budget Office) describe GDP as “A basic measure, of the market value of all financial goods and services, made within the borders of the USA, in one year.” I believe it would be more accurate to add “and sold” to this statement. As companies in the USA could make a trillion dollars worth of cup cakes to boost their economy, but if no one bought the cup cakes, it would ultimately be a loss making exercise.

The second oddity about GDP is its initial cash input: In 2012 we see global GDP at around $70 Trillion. However this does not indicate an Initial Input Revenue of $70 Trillion, as money circulates and goes through the system.
For example: If I spend $20 in cash at a Pizza restaurant, $20 is notched up in GDP. However at the end of the week that $20 note may find its way into a pay envelope, where after the recipient pays his or her rent, now $40 is notched up to GDP. Soon after the landlord may spend the $20 dollars at a shopping mall, where after, the shop it was spent in may use it to pay their electricity bill. This could all happily take place within a month or two and have generated $80 in GDP, from an initial input of $20.

On the other hand, the pizza restaurant owner may have put the money in a bank and not take it out for ten years.
Initial Input Revenue is the amount of revenue entering into the financial system, not its subsequent re-spending. Working out exactly what the Initial Input Revenue of Global GDP is, is not a simple task. If you asked me to hazard a guess of how much Initial Input Revenue was put into the system to generate the $70 trillion in GDP last year, I really could not do so. But for the sake of starting with a figure I’ve gone with $28 trillion, albeit, it could conceivable be quite a bit lower.

Before examining how the RES equation works with GDP, another consideration needs to be presented, if the network was generating most of global GDP, then the average network companies QE Efficiency would be greater. As in general, most items were already being purchased from one network company or another, as such staff QE Efficiency would rise.
As a last consideration we need to factor in Cash Flow vs. Profit. Currently GDP is calculated by cash flow, regardless of profit. However, when it comes to network economics in its finite manner as presented within this example. With the exception of tax, as every cent paid to every company involved in any sale is recorded as network profit at one place or another, network profit is much the same as GDP.

In the first spreadsheet below we consider the average QE Efficiency of a network company to be 75% with tax accounting for 25% and no Economic Black Hole. In essence a society where cash is replaced with network credits. The second spreadsheet increases the tax threshold to 30% (Note: the tax threshold is considered a total of all taxes).
Starting with our guess of $28 Trillion as the Initial Input Revenue of Global GDP, we see that despite 75% financial efficiency, if the money does not circulate, there is only $21 Trillion created in profit.

add_spreadsheet

At this point the network economy would have shrunk by 25%. RES=75% the equivalent of the USA posting minus 25% growth figures, as opposed to their +1.7% last year. For economic growth RES needs to equal over 100%
The situation corrects itself as spin is applied, as seen in rows (c) to (g). Please notice that for this example the figures have been worked out by including 50% of tax revenue within the spin calculations, as we are working on the principle that as the network is ever present, it would make sense that at least half of tax revenue was spent on network items, or staff who would spend their salaries on network items.

The effect of the five spins generates $64 trillion in profits. Which when added to the Initial Input Revenue of $28 trillion generates a total of $92 trillion. This figure would appear to be the equivalent of current GDP.

Looking at tax, we see a global collection of just under $27 trillion, with the USA collecting $5.8 trillion, 20% up on current receipts. Continuing with tax, the bottom spreadsheet looks at an increased tax threshold of 30% which increases tax revenues by 9% but decreases GDP by 13%. However this decrease would be less severe if more than 50% of tax revenue was spent on network items, which in this scenario is likely.

add_spreadsheet

Due to the five spins applied one thing in particular worth noting down. That the network profit has increased by over 400% from $21 trillion to $85 trillion.

Finally we see in row (n) that an annual growth figure is not presented. This is due to the Initial Input Revenue, which is not as simple to control. On the 25% tax model, an increase in Initial Input Revenue of five trillion shifts our GDP up 18% to $108 trillion, whereas a decrease of $5 trillion decreases our GDP 10% to $83 trillion.

Of course there will be many ways to program the system so as to stimulate Initial Input Revenue. However, it is the one factor that will always have variance due to human choice. Currently US companies are sitting on $2 trillion and China is sitting on more. If they were to spend this money, due to the natural spin within current economics, it would appear that it would have the effect of increasing global GDP by over 10%. And the world would record its most profitable year. A 10% increase in Global GDP would be recorded in financial history as a golden age.

There is another source of money that simply sits that is far greater than that of China and the US companies. That is the wealth of the top 2% of high-net-worth individuals in the world. The exact figure is not available, but they have a lot. And most of it does not get spent in ways that increase GDP. We already have an idea or mechanism in place that attempts to activate this wealth contained within the Facebook business development plan “Lx.” Which if we remember generated over $2.6 billion per US Mother Network.

Within the American Butterfly business plan as a whole, this profit centre has been excluded as it was not deemed “highly probable.” However with the aid of the RES equation, understanding just what a difference that money could make, there is another good reason for giving it a go as it also backs up the previous statement on this profit centre. That it would not be taking a portion of GDP or taking market share from another. Rather creating a new profit stream. So long as the top 2% of earners saw value in spending their money it is a win/win/win scenario.

In conclusion, I hope it is plain to see just how controllable the global economy would be if/when the network becomes the world’s main trading hub. By simply increasing or decreasing the amount of spin we cannot predict what GDP will be, rather we can make it so.

It has always been the founding principle of the network. That as we cannot predict so we need to enact, this from the first founding network physics philosophy as provided by Isaac Asimov and introduced by Anthony Rauba:

“You may not predict what an individual may do, but you can put in motion, things that will move the masses in a direction that is desired, thus shaping if not predicting the future.”

RES equation example 3 – Practical, Tangible and Usable

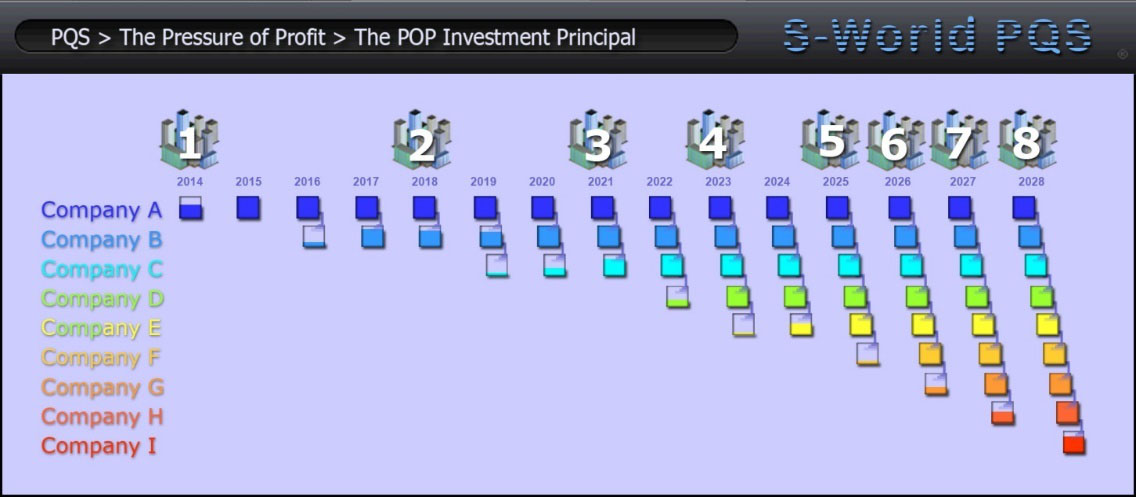
In chapter five of The Theory of Every Business we find the section: “Economic Stimulus & Investment”
Within this section we see how the first $1 billion in combined company profits might be spent by a network, including the Baby POP process.

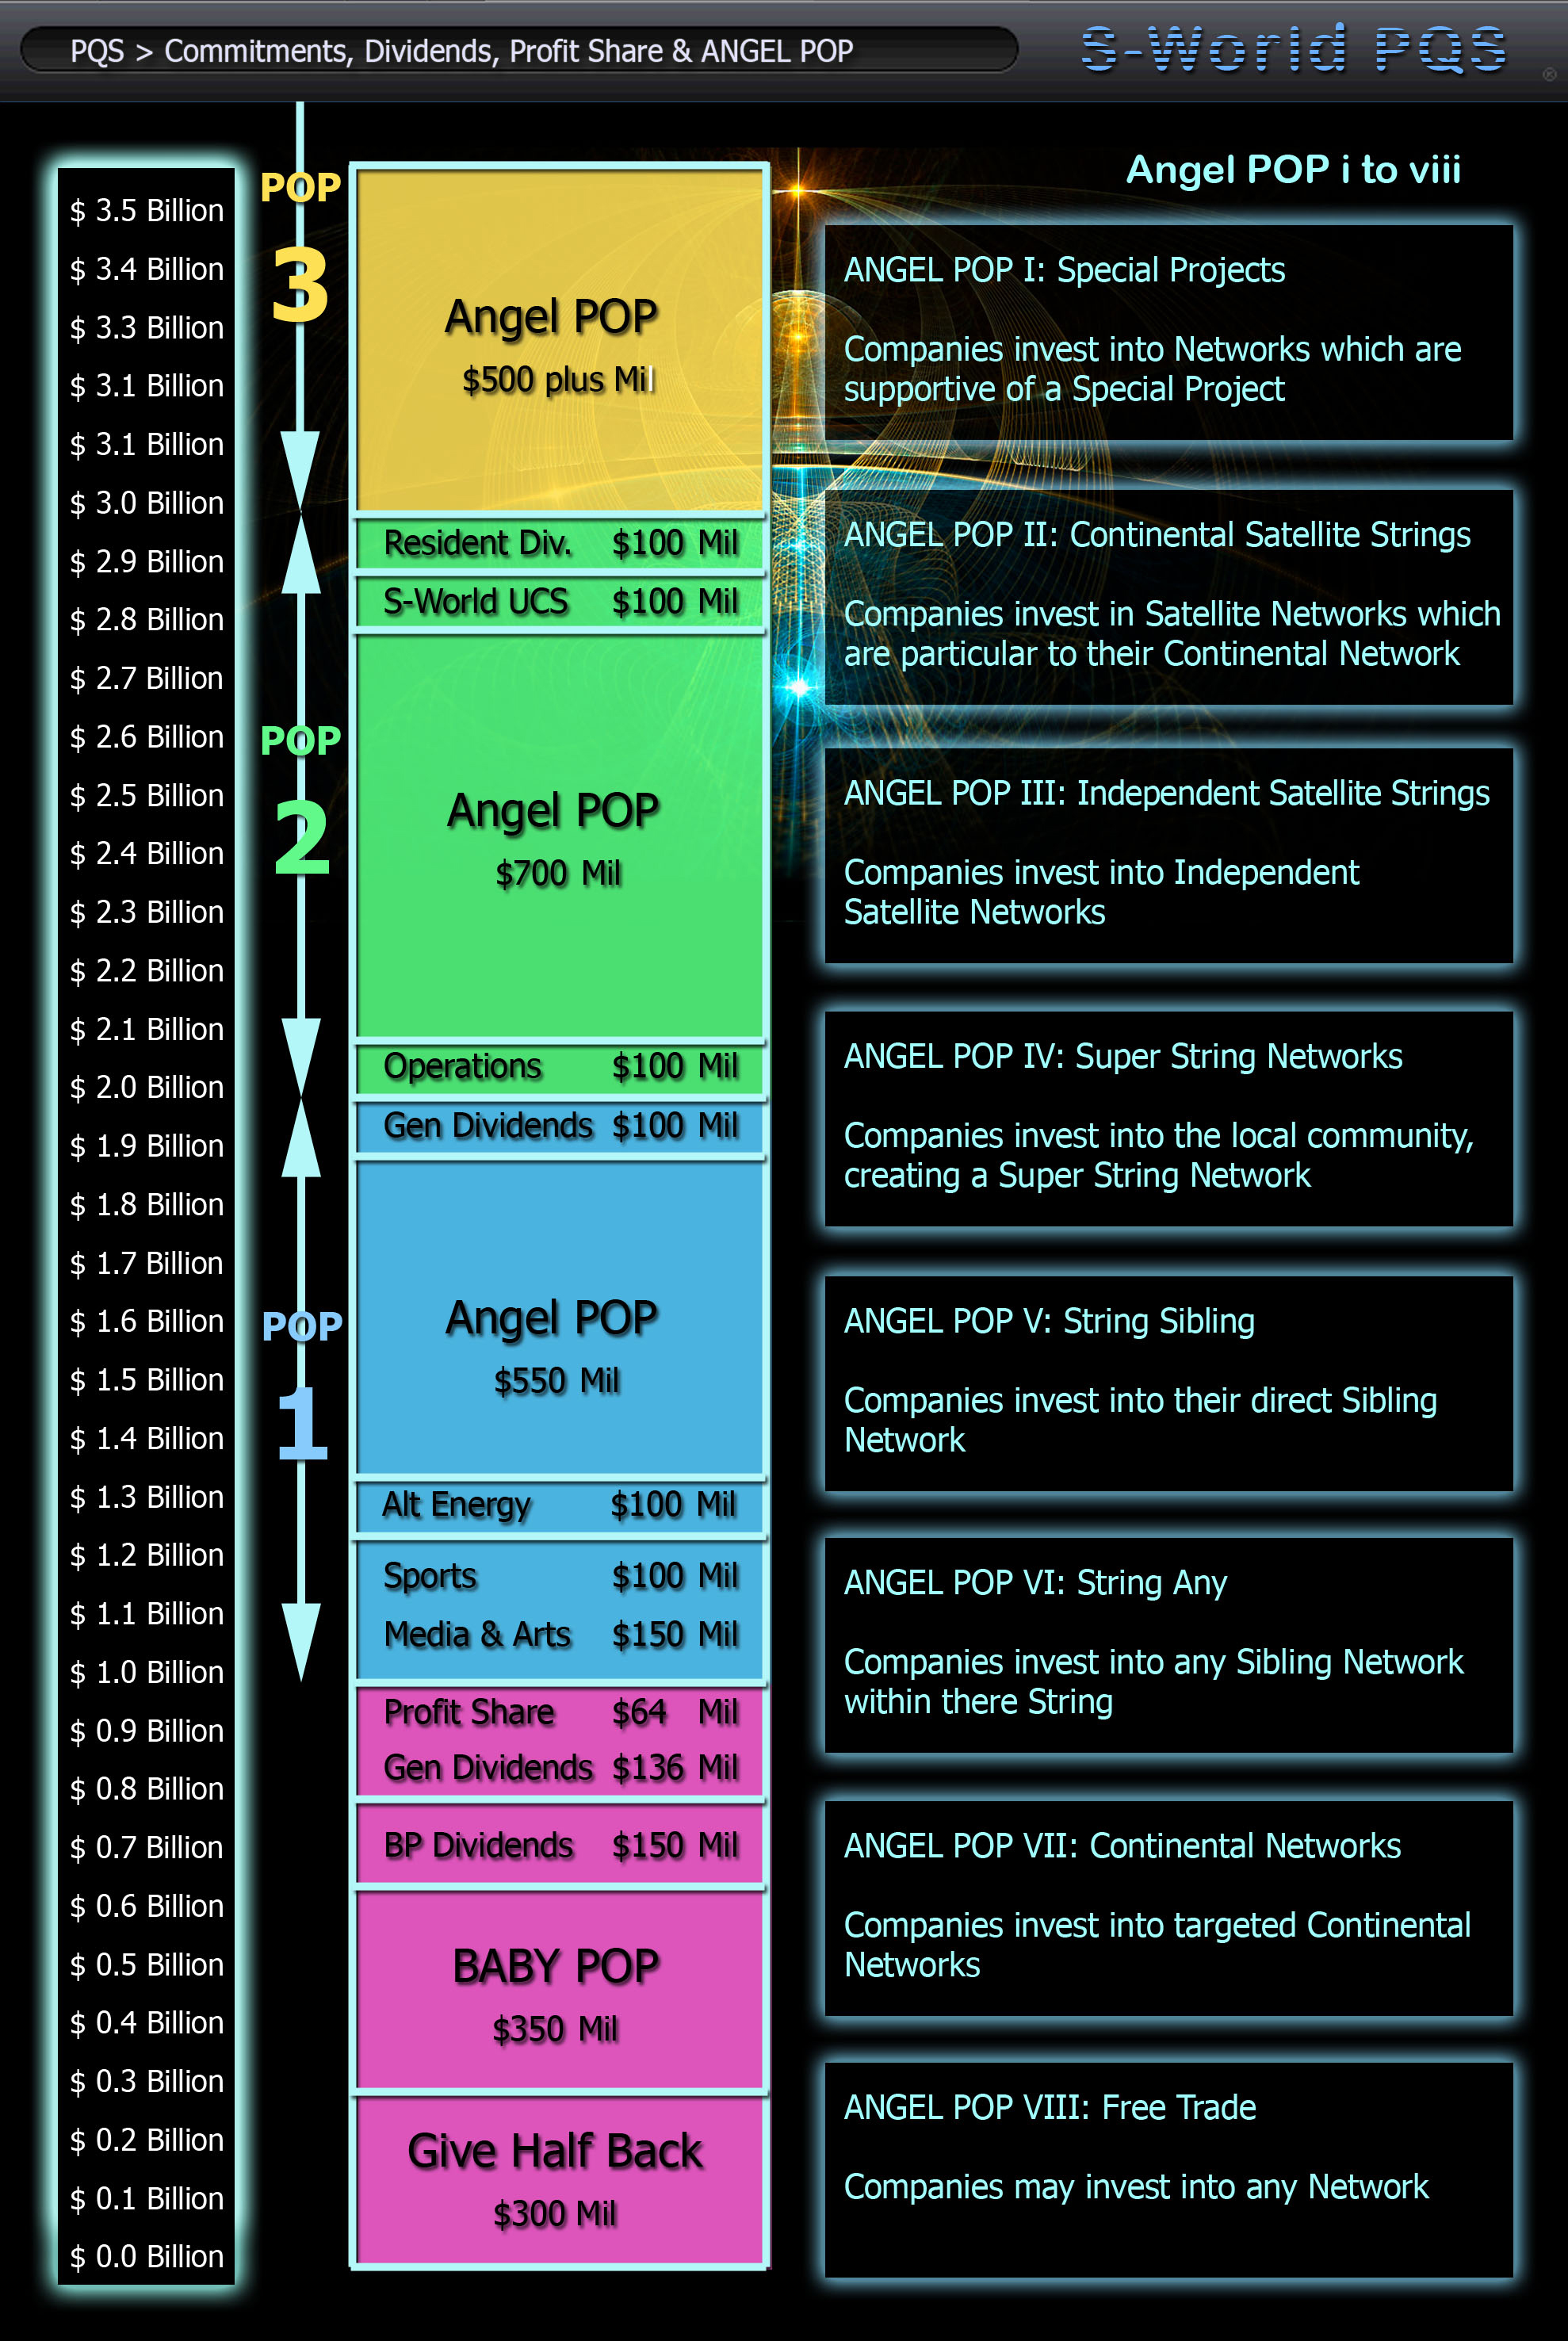
For a standard Mother Network which generates $1 billion in profit, when all is said and done, $150 million will be spent on operations. $525 million will be investment into Baby Networks and $425 million distributed in network credits to shareholders and staff.

(Note: The figures show over $1 billion due to profit share being paid to staff in network credits adding to the Economic Stimulus total, alongside the operation centre making direct profits lowering the actual GHB (Give Half Back) commitment.)

Now, with the help of the RES equation, the benefit created from “Economic Stimulus” can be calculated. Working at a 55% QE Efficiency the economic stimulus will generate $425 x 55% = $233 million.

With such profit being recreated, we consider applying more profits to “Economic Stimulus” and look for clever ways to give away money. Which when all is said and done increases the overall profit of the network. In such considerations we apply the “⇔” feedback arrow from the M⇔Bst equation (originally from the Mandelbrot Fractal).

And so the equation adapts to RES>⇔+100%

To continue we need to make a reasonable estimate of a Mother Network’s typical profit in 2018.
Starting with the Facebook figures as presented in The Theory of Every Business and further considering the revenue and profits made by their suppliers applying a 50% QE Efficiency. We forecast just over $3 billion per US Mother Network.

add_spreadsheet

However, as a result of consideration of the RES equation, the “Lx.” concept has adapted and developed significantly and is now being developed as a major profit centre for American Butterfly part 4: “The Butterfly.” Until fully developed it shall remain as a significant bonus profit centre. This being so the Facebook profit centres have been rounded down to $400 million.

Added to this are the various S-World affiliate initiatives, the profit projections made for priority partners: the other technology companies, media companies and possible pharmaceutical companies, which we hope include Apple, Microsoft and Amazon alongside most of the technology and media sector.

Details on this profit centre are presented within American Butterfly parts 4 and 5. And will in all likelihood be rounded up in a dedicated section in American Butterfly part 6. For now we work on a simple assumption that the rest of the sector combined should double Facebook’s profits. So we add $800 million.

To this we add the $245 million generated from 12.5% of the network companies applying the “Suppliers Butterfly.”
Thus far we have included 25% of the network as essential partners and 12.5% as building supplier companies. For the balance of companies we use the lowest fifth year 40% (RNL) investment vs. profit statistic, as such with an investment cost of $2 billion multiplied by 62.5% participation and a 40% investment vs. profit statistic we arrive at $500 million.

add_spreadsheet

At the starting point of this example we began with $1 billion in profit already used up, with $525 million investment into Baby Networks and $425 million distributed in network credits, to shareholders and staff.
Of this $425 million in “Economic Stimulus” network credits, $100 million has already been assigned to Facebook Stores and the profit accrued. The rest which is $325 million is to be spent directly in the network. Or by a rather complex network exchange system spent on other networks where by trade off’s the original network sees the benefits. So creating an additional $325 million x 55% (if E = 55%) = $179 million in profits for the network companies.
Now, total network profit = $1.945 million + $179 million = $2.124 billion, from which we remove the initial $1 billion that has been spent, leaving $1.124 billion.

At this point we are over the $2 billion mark. Which in trusting the original POP system as supported by the Give Half Back initiative means by rights we should have an even split of the first $2 billion: 50% should go to POP Investment with the balance paying for other items, with all overflow (the $124 million) also going to POP Investments. However with the addition of “Economic Stimulus,” and “Spin” an adaptation presents itself: 50% is used for POP and 50% is used as Economic Stimulus, with operational costs mitigated as much as possible (as always it’s a work in progress).

In this example, so far $425 million has been created in Economic stimulus. And so, of the $1.124 billion $575 million should be added to the Economic Stimulus network credits kitty. However as the additional business see more staff bonuses, which are effectively economic stimulus, only about $500 million would be needed to hit the $1 billion mark.

Effectively at this point we see about 25% of network profits. Communally pulled and used specifically for “Economic Stimulus” to be distributed as network credits, which all have a time limit on their spending. At this point any company, whose profit is garnished, is well aware it’s going to happen. And will already be making an excellent return as well as also aware that this very act is continually stimulating the network economy. Thus this protects the very mechanism that made them the money in the first place, whilst guaranteeing its continual growth.
And so, on the task of working out the best ways to distribute the $500 million in network credits and in terms of both immediate return via RES, alongside other benefits.

Currently the focus is on three types of distribution, all of which were previously earmarked for extra investment, as a guarantee of creating the necessary market dominance to be certain of S-World profits. (The largest profit centre)

Other possibilities I’m sure will present themselves in time particularly in view of Special Projects. However this distribution, ultimately, when all factors are considered makes the giving away of $500 million in network credits per network, a profitable exercise.

1. Sports
2. Media and Entertainment
3. S-World

The most effective multi-reward distribution method considered so far is the sponsorship of semi-pro sports teams. Looking at the long term macro view but also considering the advantages will be beneficial for the network at any time.

We take the 314,000,000 people in the USA, and deduct a third, as they may be under 16 or unable to play sport. Then we divide by the critical mass of 8,192 networks. This leaves 25,298 people per network. The network utilises $100 million in economic stimulus network credits, and creates a league structure of many types of sports teams, playing 30 games a year.

If this is so, on average each US citizen that can play sports would receive $132 for each game played, a fair semi-professional sports gratuity. Chances are of course that out of the 207 million people who could play, only half of that number ever will, so increasing the gratuity to $264 per game.

To raise the stakes, whilst still looking for good ways to distribute the network credits, one can assign $50 million to the professional sports division, each network offering over $1 million in prize money for many sports. With a catchment of only 25,298 people and maybe sixteen $1 million prizes per year available for different sports, our new semi-pros are highly motivated to do well. Alongside this, $9 million may go to local sports teams to help with facilities. This is alongside $25 million collected from each of the eventual 8,192 networks creating $200 billion in funding and prize money, for the elite sports men and women within the USA. To put that into perspective, last season Chelsea Football Club won the world’s richest sports prize; The Champions League, which paid them $47.7 million. This is 400 times less than the spots prize kitty for the USA networks, and 1600 times less than the global prize kitty.

Multi Reward: Moving back to 2018 starting with an E of 55%. We already know that of the $150 Million assigned to sports $82.5 Million will be automatically returned to the network as profit. (Or $112.5 million if a QE Efficiency of 75% is achieved). On top of that, should credits be valid for only a month to spend them, a third of all local residents will come and visit a Resort Network every month, creating the “full restaurant syndrome.” Thus making resorts constantly alive, and of course, when people come they may often spend some of their own money as well.
Such an initiative will create a media monopoly on sport, so if desired. Device manufacturers and broadcasters outside the network would not be able to broadcast any sports. There are sponsorship benefits of course and TV rights to be sold. But the crown in the sports economic stimulus initiative is a fit and healthy US and global populous, saving hundreds of billions in medical costs. But in my opinion most importantly also creating a more alert and more team savvy as well as a social work force. As they say, a healthy mind in a healthy body.
All told, when you add it up, the Sports Economic Stimulus initiative would be a profitable endeavour. Giving away $150 million in network credits, ultimately a profitable exercise.

Similar considerations and advantages also come from spending the money on media, entertainment and encouraging people to use S-World UCS.

Of the extra $575 that registers in the tills of the network 55% would be returned as profit, equalling $316 million and increasing the total network profit to $2.44 billion. At this point, in the same way that The Window Factory benefits from tenders provided by its future Baby Networks, by following “The Suppliers Butterfly”, a further $1billlion in revenue has been artificially injected into other companies. For them all to benefit in much the same way, increased trade.

Of the extra revenue generated over $ 1billion, $944 million is added to the initial $525 million in POP totalling $1,496 million in POP investment.

BABY POP and the M⇔Bst Equation

American Butterfly 3

The Network On A String

BABY POP and the M⇔Bst Equation

History and network profits

The M⇔Bst equation and the following point of SUSY similarity, 3: “Quantum Force Theory, Spin & the RES
⇔ Equation,” take reference from The Suppliers Butterfly as found in chapter two of “The Theory of Every Business.”

The Suppliers Butterfly illustrates various advantages the network provides to suppliers and manufacturing companies, presented as a spreadsheet following the journey of the “Baby POP” investment principle from 2014 to 2036. To accompany it, 16 feasibility questions are asked regarding specific actions that increase profitability. For instance, the first feasibility question describes and informs the reader of the advantages of the financial software and operation centres financial assistance, and then asks the question:

“Due to the increase in financial efficiency, is the 5% rise in revenue recorded in row (l) justified?

Please indicate your answer in the field below, if higher or lower write in the percentage

Higher ________ OK ________ Lower ________?”

To date, with four question sets returned, all 16 questions sets have received “OK” or “Higher” responses. This is expected, as in general, with plenty of room for leeway. I have always underestimated benefits, in a way applying a Monte Carlo method to human financial forecasting, where all probabilities, all answers, are conducive to a successful result (This point is further explored in SUSY Similarity point 14: The PQS – Predictive Quantum Software).

Whilst “The Suppliers Butterfly” presents numerous network advantages, the model was written around the advantages of tenders (guaranteed orders). In the case of our token company “The Window Factory,” from 2014 to 2036 they will exclusively receive orders for windows. This is from the 15 Baby Networks that are to be created from its string.
The results are significant as presented below.

add_spreadsheet

Before we consider “Give Half back” and its “Economic Stimulus” benefits and property holdings, in the case of The Window Factory, from an initial $2,500,000 investment they will have tripled their investment by 2018. Paying back their loan and pocketing $5,000,000 in profit. Where after by 2036 the long term forecast shows the Window Factory accumulating $129,000,000 in profit

In terms of useful profit forecasting for Mother Networks, which (before overpay) receive $2 billion in investment. If 10% of the companies that invest in Mother Networks are suppliers to the building industry. Looking at The Window Factory’s investment vs. annual profit figures in 2018 we can expect $196 million in profit from this sector (2 billion x 10% x 98%) rising to $858 million (2 billion x 10% x 429%) in 2036

As networks create their strings, it is desired for each network within a string to have a sector that uses the Suppliers Butterfly model. For instance, the first baby networks created in 2018 might receive the tenders for production of renewable energy devices.

The M⇔Bst (pronounced M and B String) tells the tale of the tender, and the creation of the strings, combining the growth model of “Baby POP” with the growth model from the “Suppliers Butterfly.”

The M⇔Bst equation (in principle)

In support of the notion that network sets can be described as having “stringy characteristics” we consider: as “Baby POP” creates 16 interrelated networks, each are stronger for it. In the case of the “Supplier’s Butterfly,” we consider the tenders as similar to spin or energy. In as much as each tender adds a new profit centre to a business within a network. This very act, as applied to the Mother Network, assists the Mother Network in its capacity to create and continue to make POP investments into the network string.

The letters and the “⇔” sign within the equation are considered as follows:
Come 2018 the combined businesses within a M (Mother) Network will have saved enough money to create a B (Baby) Network, and in time the Baby Network will grow and create its own Baby Network. This creates the beginning of a (st) string of Networks, which by 2036 creates a league of 16 networks.

One very important part of the equation is the “⇔” feedback loop, if the combined businesses within the Mother Network had not invested their money to create their Baby Networks, there then would be no guaranteed orders. By applying “⇔” the numbers flow in both directions, ultimately feeding back on themselves. This process of going round and round a loop is called iteration that the output of one operation becomes the input of another and so on, and on, and on.

The Baby POP M⇔Bst Investment principle creates the network in such a way that it can mimic String Theory, with many inter-string relationships, vibrations and spins.


(Note 1: The investments that companies make in a Baby Network return trading rights and real estate. As with the creation of a Mother Network, the businesses own what they invest in, capital assets, and often a second income generating business. As a result Mother Networks will ultimately own considerable chunks of all 16 networks in its string, creating many feedback loops).

(Note 2: Each time a Baby Network is born, it sees 50% investment from its Mother and 50% from new investors, largely small local businesses).

The M⇔Bst philosophy

Is simply that a mother has a baby, then supports and brings up the baby. And in time the baby has its own baby, creating an “extended family”. Within that family unit (in most cases) iteration will apply. And if necessary the baby will end up looking after the mother, and in general all within the extended family try to look after each other.

As a philosophy, the mechanics of the network are identical to the most natural of instincts within us. This also applies to nature itself, making a note that even plants adopt this protective behaviour. In many ways the M⇔Bst mimics basic genetics, it is nature.

The M⇔Bst equation in mathematics

Before the consideration of “Baby POP” networks having stingy behaviour, at the beginning of “The Theory of Every Business,” a graphical representation of the butterfly effect was presented.
It was suggested that:

“This graphic represents a fundamental building block for the PQS (Predictive Quantum Software) economic probability software, where within, millions upon millions of companies and staff actions are to be plotted in such a manner as to optimize the flow of money, PR initiatives and objectives we wish to achieve.

As a starting point however, one of the first brainstorming exercises will be to make a huge blow up of the image below and have everyone start sticking post-it notes on it, looking for other circular events.

baby-pop-m-b-equation

By considering an expansion of the M⇔Bst equation, where we include current and future tenders alongside new companies created by POP investment, including the tenders they might have or will receive, we have gone way past post-it notes.

Such an equation or calculation would, in plotting, be very large and changeable particularly in terms of the new business to be created and their expected tenders. However at any fixed point in time the PQS software is designed to display the current probability for each company way into the future.

This large calculation could be simplified for easy viewing.

For instance, M becomes “The Window Factory” (TWF), and “B” the number of networks that are seeing POP investment.
We shall move to 2021 and say TWF has 2 Babies in its direct string, and has created two more via “Angel POP” and Satellite String Networks. As such TWF may have tenders from 4 networks so the M⇔B changes to TWF⇔ 4. Then the ST becomes the number of networks, which will receive tenders when all strings are complete; which could be around 40 tenders, so we write TWF⇔440

Including the new business created by 2031 TWF might look more like this TWF⇔1280

By 2040 when TWF will have exhausted its supply of tenders from its initial string, due to diversifying and creating new business each time a POP investment is made we could see this TWF⇔38258

These calculations can be seen as the amount of vibrations within the strings, for each business much effort will be placed into plotting its various possible futures. Looking generally to increase its energy in terms of tenders and other profit centres. These calculations become part of the butterfly, the cause and effect dynamic of one action on another and the ripple thereafter.

CFM & POP Analogies

American Butterfly – book 3

The Network on a String

By Nick Ray Ball Nov 2012 to Jan 2013

Chapter 1.

CFM & POP Analogies

Index

1a. General Relativity (take me there)
1b. String Theory (String Feynman Diagram) (take me there)
1c. Thermodynamics (take me there)
1d. POP as Graviton Energy (take me there)
1e. POP as The Speed of Light Constant (take me there)
1f. POP as a Planck Length (take me there)
1g. Music and Chaos Theory (take me there)
1h. The McDonald’s business model (take me there)

There are a number of analogies that have been created to describe CFM and POP, some relevant to physics and some simply business examples.


1a. General Relativity

Before creating CFM and POP deep consideration was placed into the Butterfly Effect mantra: “Can the flap of a butterfly’s wings in Brazil, cause a tornado in Texas?” To summarise, I imagined a cubed grid across the world. Within one cube sat our butterfly, and on the outside of the cube the energy fluctuations were recorded. It was considered that if the cubed grid extended in all possible directions including Texas, then one could measure the energy transference of the wind from the butterfly’s flap, and see if it caused, or contributed to the tornado. This consideration assisted by the mathematics of the Mandelbrot set fractal became the father of CFM and POP and inadvertently introduced quantum mechanics.

quantum-tracking

About eight months later, following my return to England I started to see various documentaries attempting to describe General Relativity, Einstein’s Theory of Gravity, which is now generally considered as “The Fabric of Space and Time.” Often when visualised within documentaries, General Relativity is done within a series of cubes, similar in many ways to the “butterfly grid,” but extending in all directions.

When we consider the cubed nature of CFM, each cube desired to indicate a fixed amount of profit, combined with the enabling nature of “POP” first filling the cubes. Then at the fixed point diverting profit and in so doing creating more on more cubes, this is in many ways creating our own private piece of General Relativity; as we create the fabric of the network out of CFM and see POP grow more and more cubes over time. The similarity to general relativity is not just within the creation of the cubed grid, it is also within the stretchiness and elasticity within each cube. Points 1 to 8 of SUSY similarity, all in one way or another describe the flexibility of the network cubes.

Since the year 2000 the S-World network design has been virtual. Where persons and businesses can interact and see each other’s surroundings within cyberspace. Visually we can do this, and quickly: some satellite time from NASA and the NSA, rendering graphics from The SIMS/SIM City and network connectivity from facebook, all linked by the GPS’s in people’s phones. Visually and positionally a pretty accurate virtual simulation of earth can be created with the technology we have already created.
However, where is the physics? If one is to create a simulation of our earth, to assist us in many ways. To build it correctly, it needs to include the universe where our world resides in or at least a blank universe. This is where CFM and POP come in as CFM becomes a blank canvas to be viewed/discovered/created/measured as soon as the energy of POP interacts with it.


1b. String Theory

Dr Amanda Peet describes String Theory as an “extremely economical theory,” which is testament to consideration that if adapted to our economics, it would add great value. (Note: To see the original inspiration: U Tube – Dr Amanda Peet: String Theory for the Scientifically Curious, assisted by U Tube – Leonard Susskind: Lecture 1, String Theory and M Theory)

First we consider all the businesses within an individual network as havening quantum mechanical properties, specifically their uncertainty. With over 2000 businesses we cannot be certain how much profit they will collectively make.

Next we consider the network itself as General Relativity, the fabric of space and time. Which when visualised by physicists, is more often than not, done so within a matrix of cubes. Each individual network represents an individual cube, which is desired to be filled with $2 billion in profit each year.

Lastly we consider String Theory as the elasticity in the framework of the cube. Allowing it to gather all the eventual profits of the 2000 odd businesses, smoothing and calming them, applying elasticity, entangling them doing whatever it takes to make sure the final result is within range of the cube. When this is amplified by SUSY Similarity point 4: SUSY Hierarchal Spin Equalizer, which looks at the Mother Network and its eventual 15 subsidiaries and combines the profit figures from the strongest and weakest networks, the result dictates that even if an individual subsidiary network is performing way under its target, as it will partner with the strongest of the other 15 networks, the combined financial result will fall within an acceptable range.

By following POP and adapting it into Baby POP, the by-product changes the individual networks into sets. It is where one can apply certain behavioural patterns that apply to String Theory as opposed to point particles. In essence the POP growth pattern creates, not a set of individual networks, rather strings of networks.

If we look at the Feynmann Diagram on the right, we see how this works within physics. On the top left is a standard Feynmann Diagram, where only a few probabilities are effective in creating a reaction. But on the right we see the SUSY version, where as all probabilities fall within the loop of a string, and all can be accounted for.

If we look at the bottom two sections of the diagram, on the left we see a point particle or individual network, which needs to generate a fixed figure. However on the right, due to the SUSY Hierarchal Spin Equalizer, alongside other techniques, the range for success is far more flexible. As the network is now effectively built out of strings. The strings of networks work as one. Looking always to balance and protect the weakest individual parts of the network.

img_3906

Note: As soon as a network is receiving over $2 billion, additional profit (the overflow) is automatically diverted (invested) into other networks. The effect of this is to spread the development of the network across the globe, as opposed to creating giant profit centres here and there. The spread across the globe is essential as each network is designed to house an operation centre, education facility, alternate power source and hospital. Alongside which, new retail catchment areas and sets of employees are found.
When it comes to the financial implications for investors and those near new networks, both win. The new networks are half owned by the parent networks, so the rich keep getting richer, however the very nature of a network including jobs, education and medical benefits improves the prospects of those living near it.
We sum up this fiscal scenario with a simple catch phrase, “the rich get richer, the poor get richer.”


1c. Thermodynamics

In its classic form “POP” is designed to create an absolute picture of the Global or Universal economy based on certainty, whereby unless a network is performing above its $2 billion profit target, it will not be displayed. This being so, if we were to present future simulations based on the expectancy of networks becoming stable, as currently presented in American Butterfly via Baby and Angel POP. Presuming a 2014 start. In 2016 across the globe 1,024 continental networks would have been founded or designated, of which between 10% and 20% would be expected to perform above their $2 billion profit targets.

The graphic below illustrates how we might view these stable networks. All would be individual, seen scattered here and there, the majority most likely within the USA and other affluent countries. At this point, in terms of actual network size and worth, the graphic does not offer a good global yardstick for success, as we are not seeing the other 80% or 90% of networks that are on their way.

pqs-continental-cube-networks

As we move the time slider forwards, more individual networks would appear. And as Mother Networks create their babies and the babies become stable we would start to see the networks clumping together in sets. This practice would continue and over time creating quite a cluttered pattern, with the USA and European cubes nearly complete shortly after the “boat networks” (last in string) are complete towards the end of the 2030’s.

At which point the phenomenon presented as point 7 of SUSY Similarity “Angel POP” dictates that over the next decade accelerated growth will complete all the global cubes, and we would see the following picture.

pqs-8-continental-cube-networks

When considered as a Global Picture, as seen above, each of the large continental cubes represent 4,096 stable individual networks. For a continental cube to be displayed; all networks within it need to be stable (perform above their $ 2 billion target). In the case of a cube containing networks that are not stable, it would appear broken into smaller cubes.

At this point, at a glance, the picture gives a very good indication of the economics of the network. This picture suggests that each network is comfortable, and collectively the network is generating over $65.536 trillion in profit before tax. As will be explored within SUSY point 3 “The RES Equation,” as profit from all sources is counted when looked at from a relativistic (big picture) vantage point. The network profit is very similar to what is called GDP (Gross Domestic Product) which is currently just over $70 trillion.

As all networks are stable and all are to invest half of their annual profit plus overflow via POP method, with the continental cube complete and stable, at this point a serious acceleration into “Special Projects” may be considered. Or via methods considered within SUSY points 5 and 6, increased attention will be placed into satellite networks, or the network may look to increase its size in high population areas.

Thermodynamics states that within our universe there are more ways for systems and atoms to fall towards disorder than order. This concept is known as entropy. However the POP investment principle appears to create the exact opposite effect. Creating and sustaining order wherever it is implemented, with an almost passionate desire to create more and more stable networks. Over time, the “POP” principle sees the economics of the network drift to ever greater and greater order. Defying the laws of thermodynamics which sugest systems drift towards ever greator choas.


1d. POP as Graviton Energy

The graviton is the theorised messenger particle that transmits gravity; it has no mass and spin 2, the spin being its energy.

Looking at POP investment in terms of the “graviton messenger particle” may assist the process. Consider looking at the Global Network from a physical vantage point. One would see a relatively even spread of physical objects growing in an organised fashion: Resort networks, energy sources, medical and educational centres easy to spot. Look deeper and one would see people living, working, playing. One would need to know where to look, and to look deep to find the hardware and the server banks, but they would be there.

What one can’t see physically is POP, without which, none would grow. POP is the energy of the network, hidden as electronic bank transfers; it exists, it is very powerful. But unless you know how to look for it, like the graviton, the uninitiated observer would have no idea how the network structure was growing and what was energizing it.


1e: POP as The Speed of Light Constant

POP also has similar properties to the Speed of Light, as it is a constant: $2 billion in profit by the time the earth revolves round the Sun. What we learn from this is that to create infinite profit, takes infinite POP investment, which may be an obvious point. However it does highlight the fact that due respect needs to be paid to the law of diminishing returns.


1f: POP as a Planck Length

However, in view of M Theory, Membranes and multiple universes in general. If a constant is to be considered, it needs to be one that may be unique to all Multiverses. So far the Planck Length seems suitable. As such, when everything pans out, POP may not be $2 billion; rather its equivalent in Planck Cubits $2.283 billion as that is a Planck Length x 8 x 50 (needs verification). Considering this method would dictate network growth, all network operations would be synchronised (directly divisible) by the Planck Length.


1g. Music & Chaos Theory

If we consider Jimi Hendrix, we would not necessarily apply the phrase “An Island of order in a sea of Chaos.” Indeed, we would not use the word “order” at all.

Imagine a Jimi Hendrix song. Now consider him playing wild and free, live, playing freestyle, jamming with the band as opposed to following a particular song structure. But, despite the chaos, the song has order. As applied by the percussion, and the compartmentalizing of time by beats, which keeps everything together.

The POP investment principle follows this pattern, where companies trade wild and free. Making as much as they like, but at a certain point of profitability a line is drawn. Like the end of the bar of music from which point onwards, the additional profit is invested into a new network, and the proverbial next bar begins.


1h. The McDonald’s business model

For over 20 years, come rain or shine, McDonald’s have increased their dividend yields. There is a good argument if they had not, then they would have overtaken Apple as the world’s most financially successful company, especially if they diversified.

This is why…

McDonald’s controls the franchises of over 30,000 restaurants and take about 5% of their turnover each year. One part of this is used to pay dividends. Another part is used to purchase new land to build more restaurants, and to open more franchises. Each new restaurant increases their overall income. And at the same time McDonald’s is continually increasing their balance sheet with more capital assets. As long as people still wish to eat at McDonald’s, it’s a continuous growth model. But if decided not to eat at their restaurants, the company is still strong and in a good position to diversify.

Please consider: tomorrow if Quantum Mechanics went on strike, Apple, Facebook, Google and Microsoft would be out of business and save any offices they may own, be penniless. Alternatively, if the world turned vegetarian, McDonald’s would still be worth billions and billions of dollars.

This principle works it is a tried and tested model. When applied to the network, considering the diversity of businesses, each new network brings in a new set of local businesses, new foot traffic and a new research and development team, alongside a new operations centre.

From a business perspective it makes perfect sense.