Part 2
Š-ŔÉŚ™ Financial Engineering
Supereconomics Book 2
THE HOW
Š-ŔÉŚ™ Financial Engineering (Video 34b)
Next, we see four illustrations of Š-ŔÉŚ™ inspired by Kate Raworth and Donella Meadows.
The power comes from the monopoly effect É, where if É = 100% the network of businesses is exclusively buying and selling within the network. And we can use combinations of É and Śpin to increase the cash flow.
History 3 www.angeltheory.org/video/34b
(+ video/34 & 34c)
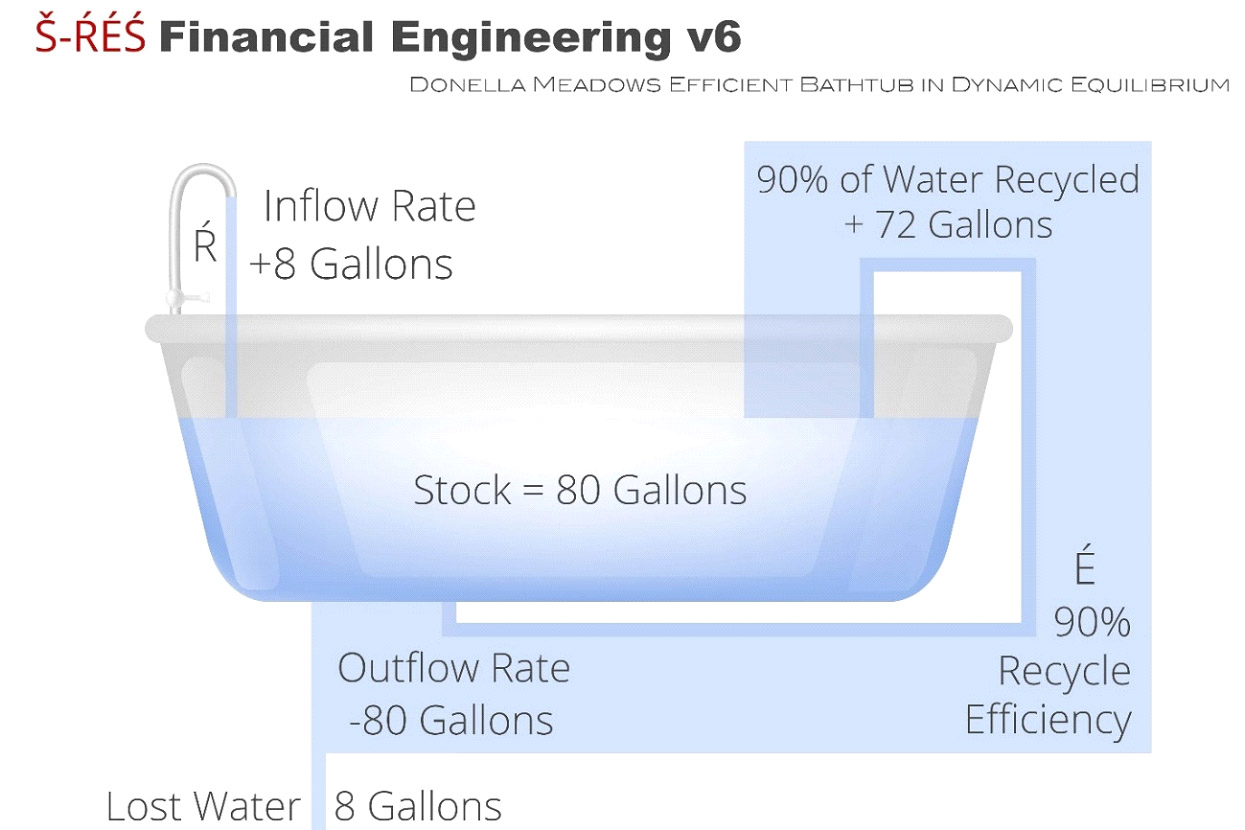
- Ŕ is for Ŕevenue – How much new money is added to the system. It is a combination of investment, sales, exports, and aid that the Network City receives within a year.
- É is for recycle-Éfficiency – In this case, É = 90%, so 90% of the money that would have escaped down the drain is captured, conserved, and returned to the network.
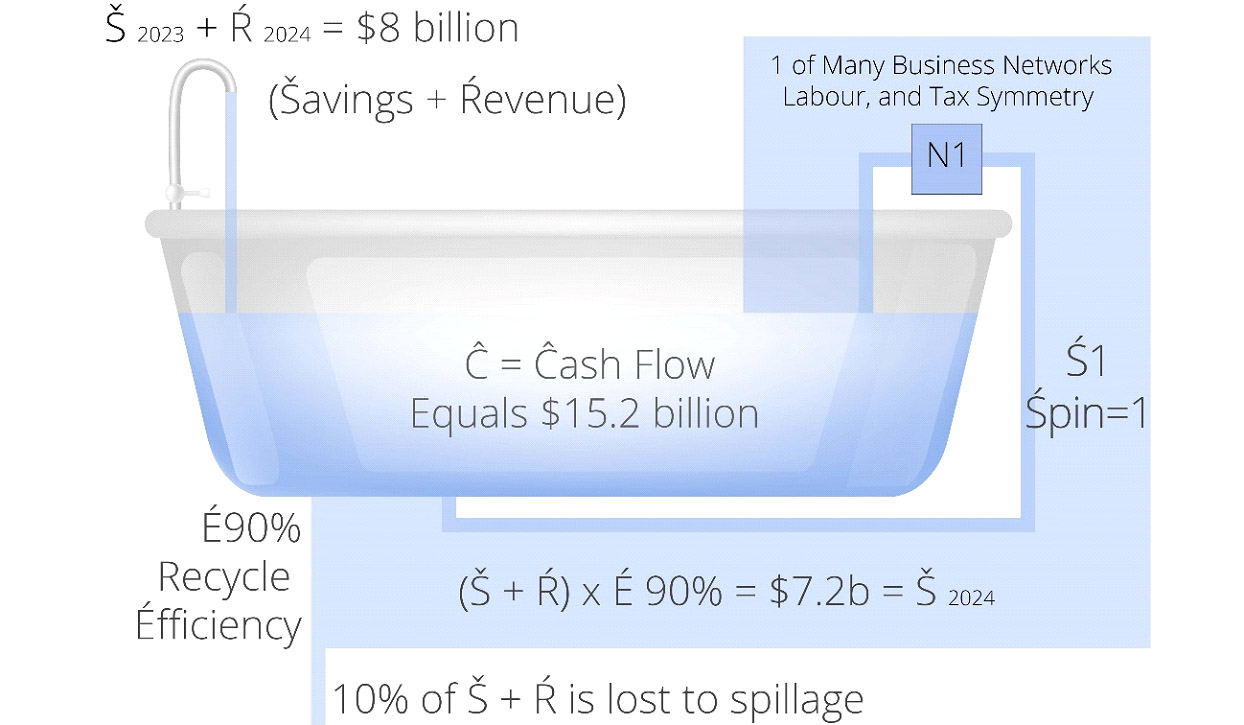
- Ś is for Śpin – The number of times the system completely recycles. In the illustration above, we see this only once, so Śpin is one – written as Ś1.
- Š is for Šavings – The amount of cash flow left after the last Śpin in a year, which carries over as revenue that we call Šavings the following year.
The Ś in Š-ŔÉŚ™ Financial Engineering
Š is for Śpin The number of times the system completely recycles. In the last illustration, we see this only once, so Śpin is one (Ś1). In the illustrations below, we see Śpin 2 and Śpin 3.
The trick is to apply Śpin, so the network spends all its cash flow more than once a year.
Staring with $8 billion in Š+Ŕ (savings and revenue) and a recycle-Éfficiency of 90% each company spends 90% its cash flow on labour, parts, goods and services from other companies in the network, evenly spread so, at the end, all the companies in the network have received roughly 90% of the cash flow they started with.
Critically this happens in the first seven months (Jan to July). Then in August 2025 we apply Śpin and spend the recycled $7.2 billion. Thus, the cash flow for the network in 2025 increased from $8 billion to $15.2 billion USD.
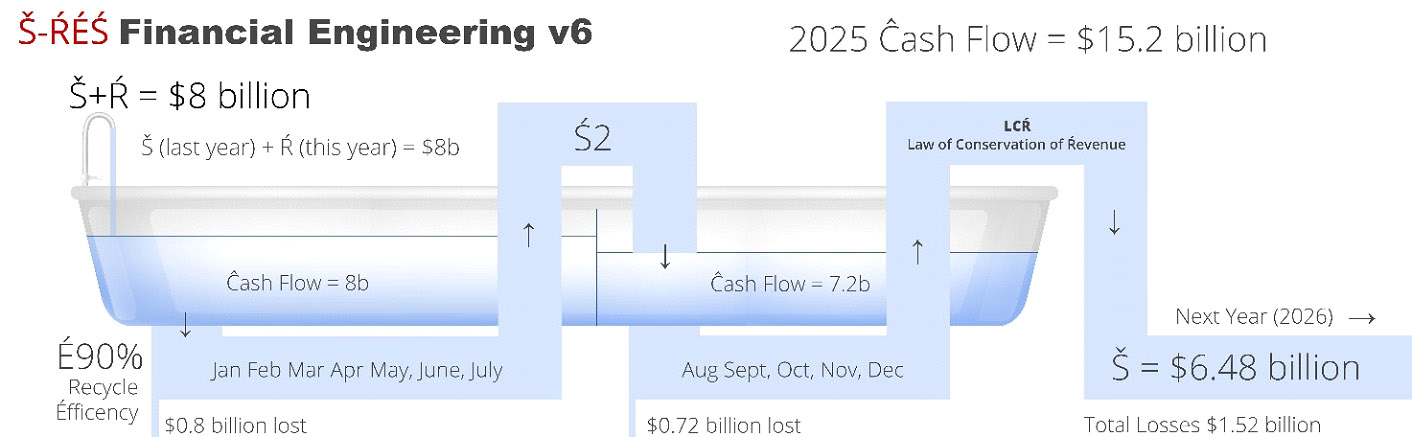
lastly comes the Šavings, which sees $6.48 billion left in the network (in cash USD) carried over to 2026 and the next graphic.
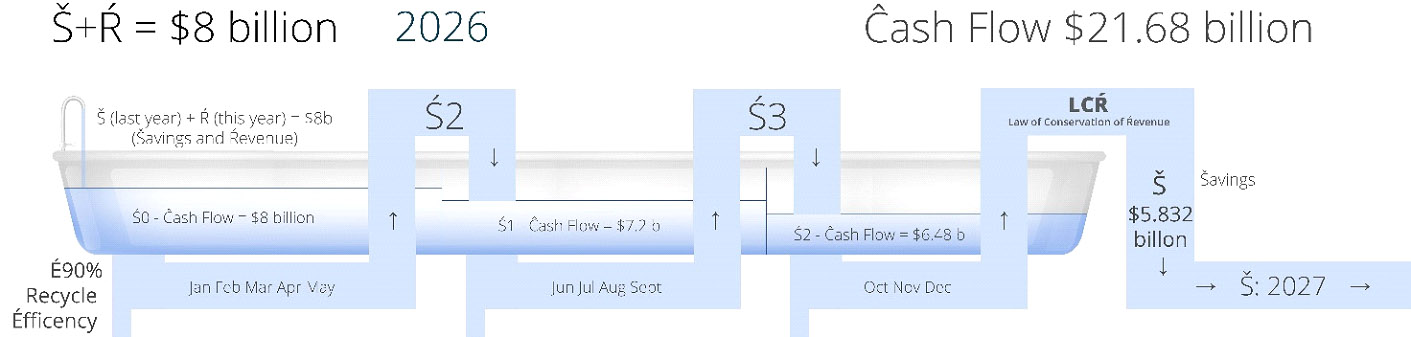
In 2026 by shortening the time before the first Śpin from seven months to five and shortening the time of the second Śpin to four months, then adding a 3rd Śpin from October to December. By the end of the year, we increase cash flow in 2026 to $21.68 billion. Plus $5.832 in Šavings carries to 2027
Below we start looking at the S-World Spreadsheet: Supereconomics–4-72
Moving to History 3 figures, these cash flow figures are critical, and are found on the spreadsheet tab; H3) ŠÉŚ-v5 | S-World History 3b – This is the most important tab within the spreadsheet. The best way to look at them is via the video.
www.angeltheory.org/video/34b (+ video/34 & 34c)
Below, we follow the same pattern as seen in the bathtub illustrations and jump to the cash flow that amasses in the Malawi Network HISTORY 3 Simulation. Staring with $5.7 billion in 2024 and ending with the equivalent of one percent of global GDP, and the building of over 10 million quality homes by 2080. (Tab: H3) ŠÉŚ-v5 Cash Flow & Housing)
| Š-ŔÉŚ™ | |||||
|---|---|---|---|---|---|
| History 3b | |||||
| Cash Flow | |||||
| 2024 | $ 5,685,975,000 | 2043 | $ 550,714,971,856 | 2062 | $ 3,376,984,627,114 |
| 2025 | $ 14,894,843,486 | 2044 | $ 589,005,884,788 | 2063 | $ 3,552,322,716,992 |
| 2026 | $ 26,848,936,252 | 2045 | $ 626,776,157,817 | 2064 | $ 3,735,466,074,599 |
| 2027 | $ 40,971,349,217 | 2046 | $ 664,266,326,401 | 2065 | $ 3,926,947,476,099 |
| 2028 | $ 53,185,830,818 | 2047 | $ 701,751,588,557 | 2066 | $ 4,127,305,216,341 |
| 2029 | $ 63,141,839,466 | 2048 | $ 867,395,313,639 | 2067 | $ 4,337,086,514,746 |
| 2030 | $ 71,509,098,453 | 2049 | $ 1,075,319,548,307 | 2068 | $ 4,556,850,627,653 |
| 2031 | $ 79,448,245,354 | 2050 | $ 1,283,942,425,681 | 2069 | $ 4,787,171,721,158 |
| 2032 | $ 106,194,771,025 | 2051 | $ 1,492,617,377,974 | 2070 | $ 5,028,641,551,041 |
| 2033 | $ 142,028,749,241 | 2052 | $ 1,700,924,978,432 | 2071 | $ 5,281,871,990,009 |
| 2034 | $ 180,559,704,269 | 2053 | $ 1,908,662,235,155 | 2072 | $ 5,547,497,437,108 |
| 2035 | $ 221,041,648,096 | 2054 | $ 2,115,827,746,778 | 2073 | $ 5,826,177,139,597 |
| 2036 | $ 262,772,540,960 | 2055 | $ 2,322,603,780,468 | 2074 | $ 6,118,597,453,737 |
| 2037 | $ 305,124,961,846 | 2056 | $ 2,458,677,324,414 | 2075 | $ 6,425,474,067,699 |
| 2038 | $ 347,569,259,536 | 2057 | $ 2,598,598,977,445 | 2076 | $ 6,747,554,207,063 |
| 2039 | $ 389,688,563,209 | 2058 | $ 2,742,999,154,713 | 2077 | $ 7,085,618,841,083 |
| 2040 | $ 431,185,712,853 | 2059 | $ 2,892,474,879,905 | 2078 | $ 7,440,484,905,993 |
| 2041 | $ 471,882,760,113 | 2060 | $ 3,047,597,735,540 | 2079 | $ 7,813,007,560,030 |
| 2042 | $ 511,714,147,224 | 2061 | $ 3,208,920,785,137 | 2080 | $ 8,204,082,483,521 |
| % of Global GDP: | 2080 | 1.07% | |||
| Social houses built: | Villas: | 10,118,720 | |||
From this base, the POP Law (chapter 18) increases the number of companies from 2048 in 2024 to 327,680 in 2080. We don’t see it, but on average, each company has 32 personnel for a total of 65,546 personnel earning $21,690 in 2024 who pay 25% of their remuneration towards Paid2Learn welfare, where 262,233 people benefit from $1,356 each year, which does not sound like much. But the World Bank says that, in 2018, the average Malawian made only $250 a year; thus, $1,356 is substantial.


