ŔÉŚ-supereconomics
Paradigm Shift – ŔÉŚ Supereconomics
For the latest on Supereconomics, please go to it’s parent website www.Supereconomics.ai
Book 2. Part 2. A More Creative Capitalism
Book 3. The GDP Game
www.AngelTheory.org
By Nick Ray Ball 29th May 2018
Dear Evaluator,
Thank you for your time.
The ŔÉŚ Equation (Ŕevenue x Éfficiency x Śpin)
Before we begin, the objective is to prove that, under the conditions set out, we can turn one unit of capital ($1) into five units of capital ($5) in 2024, and 25 units of capital ($25) in 2039 due to increasing the money supply per the ŔÉŚ equation (Ŕevenue x Éfficiency x Śpin).
After 7 years’ work and more than a few million words of detail, my project Angel Theory – Paradigm Shift is finally ready to share with the academic and philanthropic communities. However, a single ‘burning question’ has risen to the surface.
The ŔÉŚ Equation (Ŕevenue x Éfficiency x Śpin) is simply ‘Initial Ŕevenue’ (for instance investment) multiplied by ‘The Éfficiency of a Company,’ specifically the percentage of cash flow that is spent by a company on goods and services from other companies in the same network. And ‘Śpin’ is the amount of times that cash flow is spent and re-spent within such a network within a year.
Note that I have placed the accents over the Ŕ, É and Ś so that when they are mentioned in a sentence, they stand out.
So far, I have already received three positive verifications. The most recent from my good friend Kate a qualified accountant with a double first from Cambridge. However, I am yet to receive a verification from an economist; which I wish to gain before I move on to the leading experts in the physics discipline of M-theory, which I have used as a base influence for many systems.
Importantly for all, at this point, please do not question ‘Ŕevenue’ or ‘Éfficiency’; these are covered in great detail within the project’s 8 books and previous works. But today, we are focusing only on the Śpin quality of the ŔÉŚ Equation. But before we look specifically at Śpin in a network economic situation, let’s consider the principle as a thought experiment from everyday life.
Open your wallet and if you have one, pull out a $10 note and imagine you had a system that can record its journey for a year. So, I have $10, and I spend it at a restaurant, then the restaurant pays a staff member, and that staff member then spends it on something else. That’s a Śpin of 3 (Śpin-3). What would the Śpin be over a full year? The Guardian says depending on the value of the note, it changes between 7 and 247 times a year and other sources suggest similar.
Now, imagine that one had a network that could provide almost all goods and services one could desire; and add the condition that 85% of the time, the bank note must be redeemed at one or another business in the same network. But for simplicity, let’s change that 85% to 100%. If so, if Śpin was 8, from a single $10 investment or sale, the network of businesses would create $80 in cash flow and sales; which would equal about $52.93 in Output/GDP, assuming the David A. Moss inspired Cash Flow to GDP variable (DMCV) as currently predicted is 66.163%.
Or if Śpin was 20, that the $10 Network Credit would create $200 in cash flow and sales, which would equal about $132.33 in GDP.
Now, to work in figures more befitting macroeconomics, we change the $10 note to $10 billion; and of course, any business, network or country that could turn $10 billion in investment or trade into $132 billion in real (not nominal) GDP can create great change in countries in abject poverty, or in fact anywhere.
Of course, in the West or any rich country, this network would severely infringe on monopoly and antitrust laws. And whilst this is probably true of most or even all countries, there are compelling reasons for countries with a low GDP, such as Malawi, to make an exception to antitrust laws; if ‘and only if’ the network of businesses’ primary objective is to better the lives of all Malawians and the environment in general.
At this point, it is necessary to introduce:
The Network’s Philanthropic and Ecological Ambitions:
How the Network will achieve its Philanthropic and Ecological Ambitions:
Which clearly show how the S-World Network will achieve its philanthropic & ecological targets as a consequence of the business activity; and that such targets are the reason for the network in the first place.
A More Creative Capitalism / A Progressive Tax of Income
Moving now into the analysis and starting with tax in 2024, on spreadsheets 1.32c (cautious) and 1.35c (standard).
On either spreadsheet, Tab 1, 2024 – AN:87, we find the Lake Malawi Grand Network expected additional tax revenue (paid in Network Credits); which is more than 4 times what Malawi would expect to receive from all other taxes. Then in 2039 (Tab 2), Malawi can increase further, between 20 times (spreadsheet 1.32c) and 100 times (spreadsheet 1.35c), the difference being a 5% leakage applied to 1.32c.
The 1.35c spreadsheet shows 2.4% of global GDP. But on the Angel Theory homepage example, we show the cautious spreadsheet result from spreadsheet 1.32c of 0.4% of global GDP, which (in any case) is still a significant increase.
Obviously, a lot of things need to go right, and that’s why we have 8 different books and 7 years of planning; most of which is how to create the software for the operation alongside global operations, and a truckload of metaphors, analogies, and simulations from theoretical physics that certainly are relevant to behavioural economics. And I hope they are also deemed as significant by the greater economic community, as we note the tagline from Book 2: ‘M-Theory, an Economic Science?’ as seen below alongside Professor Edward Witten, the father on M-Theory.

However, today, we are only concerned with one thing… the Ś in the ŔÉŚ Equation.
The Ś in the ŔÉŚ Equation
Please watch this six-minute video https://youtu.be/20lWlqbgkt8 from spreadsheet 1.32b.
There are 8 books of supporting detail that have taken 7 years to prepare. However, for now, we are just looking at the Ś in the ŔÉŚ Equation. For simplicity, I have decreased the figures from the accompanying spreadsheet (1.32c) from billions to thousands.
From the first tab on the spreadsheet, start at Column ‘E’- Row ‘5,’ this is half of the Initial Ŕevenue, $2,748 (which can be from investment, income from trade, or other).
This is allocated to ‘G5’ as initial spending. And in ‘H5,’ we see an Éfficiency of 90%. Then in ‘J5,’ we see a 5% tax deduction. However, tax is now handled in a different way, so effectively we have an Éfficiency very close to 85%, making $2,350 paid to other companies or personnel in the network. This is Śpin 1. The money supply (the cash flow within the network) has now increased by $2,350 to $5,098.
It’s important to know that there is a sophisticated system for personnel, where for the most part, they are paid in ‘Network Credits.’ And in fact, all payments to network companies are made in ‘Network Credits.’ One Network Credit can be considered as one USD but with two conditions: Firstly, it must be spent on one or another good or service (from real estate to a bottle of wine) produced by the network. Secondly, it must be spent within a time allocation. This creates the Śpin.
I have found it simplest to consider this in terms of cold hard cash changing hands. So, in January 2024, Company A received $2,748 in cash in USD. Then, before March, it used the money to buy goods and / or services from Company B and paid in cash, with 15% of the original money being spent on other things we do not know about.
Company B has been paid $2,350 before March for the goods it provided, then in turn, it pays $2,009 to Company C before mid-April, again in cash, buying more goods and services.
Now, the cash flow within the network is $5098 + $2,009 = $7107, from the original $2,748.
It’s important to know that the above is a very simplified version. I have a spreadsheet the size of the moon about how the actual cash flow is spent including staff and 32 different industry sectors. We are not concerned with this today, we are just interested in the Śpin.
Moving along the spreadsheet, we see 8 Śpins in total equals $14,937 in cash flow, made from the initial $2,748 investment, an increase of 544%.
Or if we look at ‘Tab 2 – 2039 – ŔÉŚ 16,’ we see an increase in Éfficiency to 100% and an increase in Śpin to 24, which creates an increase in cash flow of 2400% or 2500%, seen in column ‘DB4.’
Is 24 a lot of Śpins? At first it seemed so to me, but when we consider the average £20 note passes hands 247 times each year, it now seems like a very manageable figure.
Ok, so there we have it. From an accounting perspective, all of the above except the last paragraph has been deemed fine so far. So, let me give a little more detail to the last paragraph, and this is also a good opportunity to showcase that ‘M-theory, an Economic Science?’ we heard about.
And whilst it’s not really his work per se, it helps to know that M-theory is not an obscure part of theoretical physics. As the late Stephen Hawking declared, “M-Theory is the Theory of Everything Einstein was hoping to find.”
It was also Hawking’s literature that inspired the ŔÉŚ É = 100% equation model; which I dubbed as ‘Hawking’s Infinite Accumulation,’ which started with a description by Hawking of the law of conservation of energy, in which energy can only be converted, not destroyed, and a will to create a symmetry or simulation of this in the economics.
The ŔÉŚ Efficiency = 100 is that solution, when É = 100%, the Initial Ŕevenue is the same for each spin. So, if Ŕ = $1 billion and you Śpin that 24 times in a year, one will have created $25 billion in cash flow.
However, there’s more to this infinite free lunch. At the end of the year, the Ŕ is added to the rest of the Initial Ŕevenue for the following year. See this at DF:29 in standard spreadsheet 2038, added to CZ:46 in standard spreadsheet 2039 being added to 2039 Initial Ŕevenue.
3 Economic Sources
Thomas Piketty, Paris School Economics
‘Capital in the Twenty-First Century’
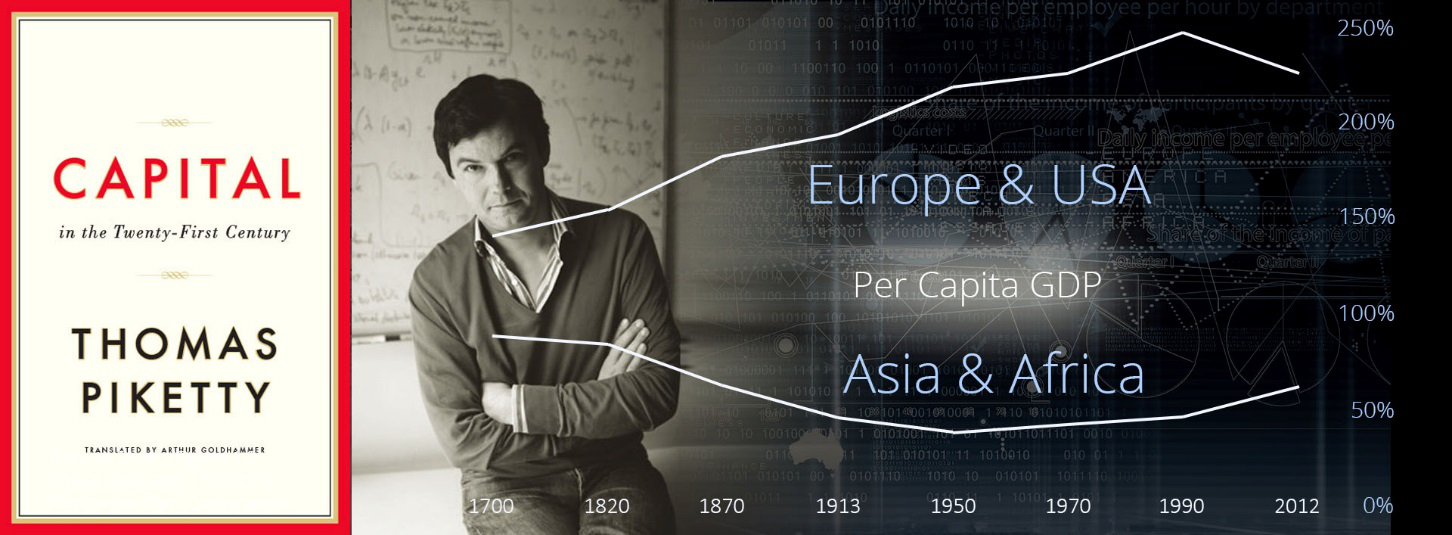
Thomas Piketty is an expert in data and the economics of inequality. Piketty presents the undeniable fact of convergence; for the last 30 years, Asia and Africa have been catching up (in GDP per Capita) with Europe and the USA. This is unlikely to change, and most smart investment funds (such as HMC) now look for the safest emerging markets.
Having spent 10 years in South Africa and having the privilege to employ a number of Malawians, I can tell you with complete conviction, that if there is a safe place in Southern Africa for a significant investment in terms of stability, that place is Malawi. The people are inherently nice and incredibly peaceful and also very hard working. Malawi also scores high for ‘ecological impact.’
Because half of Malawi has already been deforested and that is the land we would use, it is in key with our primary network rule for all developments. That is, on average, each square km of land that is to be developed must see half the land rezoned as nature reserve and reforested; and over time, repopulated with indigenous animals including Elephants, Rhinos, Cheetahs and Wild Dogs. Because of this, alongside many solar and other green energy initiatives, the Lake Malawi Grand Network creates a significant win for the environment. Albeit not in anywhere near the win that desalinization Special Project 11. ‘African Rain’ desires.
Getting back to Piketty’s work, in the mid and long term, poor and emerging countries that have the best education and trade routes will catch up (converge) quicker than the rest. I have many quality chapters on education and trade routes, add to that the safeness, and Malawi is a great candidate for super-convergence.
Richard Thaler, 2017 Nobel Prize Winner
‘Misbehaving: The Making of Behavioral Economics’ & ‘Nudge: Improving Decisions about Health, Wealth, and Happiness’
Thaler’s book ‘Misbehaving: The Making of Behavioral Economics’ really deserves a lot of credit. But to summarise, Thaler suggests that economics is not always perfect as sometimes people make bad choices. This point goes to the heart of the software designed to assist and monitor the network: Book 4. The TBS™ Total Business Systems, Book 5. S-World VSN™ Virtual Social Network, and Book 7. S-World UCS™ Tutorial, Recruiting, and Simulation software.
David A. Moss, Harvard Business School
‘A Concise Guide to Macroeconomics: What Managers, Executives, and Students Need to Know’
David A. Moss’s book made some interesting points but does not discuss the money supply being increased by Śpin. He does, however, present the Keynes Money Multiplier which is similar.
In macroeconomics, Keynes suggests that in times of recession, one should borrow and spend; working on the principle that as money is spent and re-spent, it can increase the investment (Ŕ) by as much as 5 times, as the money is spent and re-spent.
One could write this as…
Ŕevenue x Leakage x Śpin
Where as ŔÉŚ is
Ŕevenue x Éfficiency x Śpin and is designed to be used always, not only in recessions.
Plan B. The Money Multiplier
If for whatever unforeseen reason we can’t use ŔÉŚ as presented, then the next best thing is to use the ‘Money Multiplier’ presented in David A. Moss’s book.
The money multiplier is when one has some M1 money – cash or demand deposits (checking accounts) and this is given to a bank, who in turn must keep 10% in reserve and can lend out the rest; Moss suggests that if all the money was always in a bank account, that the increase in the M1 money supply would be tenfold. Albeit he immediately interjects to say that, in most cases, the multiplier is much less, but is not specific, so I have considered it to be between 3 and 4.
If we can use ŔÉŚ as presented above, then I’m pretty sure (if we can find a bank to do so) we can increase ‘Initial Ŕevenue’ relative to Éfficiency; which at 100% would create a money multiplier of 10. But practically, in early years, an 85% É could create a money multiplier of about 8.
ŔÉŚ problems already solved
Error 1
In GDP accounting, ‘Total Sales’ are not equal to GDP, as one only counts the final good/service/product, not the parts.
Solved by the David A. Moss Cash Flow to GDP Variable (DMCV), which is found at AI:211 in the 3rd tab on all the spreadsheets, ‘The Sienna Equilibrium 1.06.’
Error 2
Usually, if a country with its own currency – like Malawi – were to increase output (GDP) by say 500%, then its currency would decrease by the same amount.
Solved by working in USD, not local currency. And as such, even though the figures involved are more often heard in macroeconomics, ‘Supereconomics’ is not macroeconomics.
Error 3
The high Éfficiency score (from 85% to 100%) would see the monopolies commission investigate and antitrust laws enacted (as to have an Éfficiency of 100% is to create a 100% monopoly).
This can be solved, potentially, by working in countries like Malawi with low GDP and no plan to improve. Given the forecast shows an increase in GDP of 5 by 2024, and tax spending about the same, no one would think poorly of Malawi for discarding antitrust in the case of a network that was created to improve the lives of its people and the environment in general.
What next?
Next, if no one can find an error, I wish to create highly complex software, as is described on www.AngelTheory.org and Network.villasecrets.com which will simulate the network’s future before seeking to create the network. Two points in particular need to be simulated: the ‘Comparative Advantage’ trade hypothesis and ‘Network Cities,’ as both are key to Lake Malawi and other Grand Networks’ success.
For the latest on Supereconomics, please go to it’s parent website www.Supereconomics.ai


